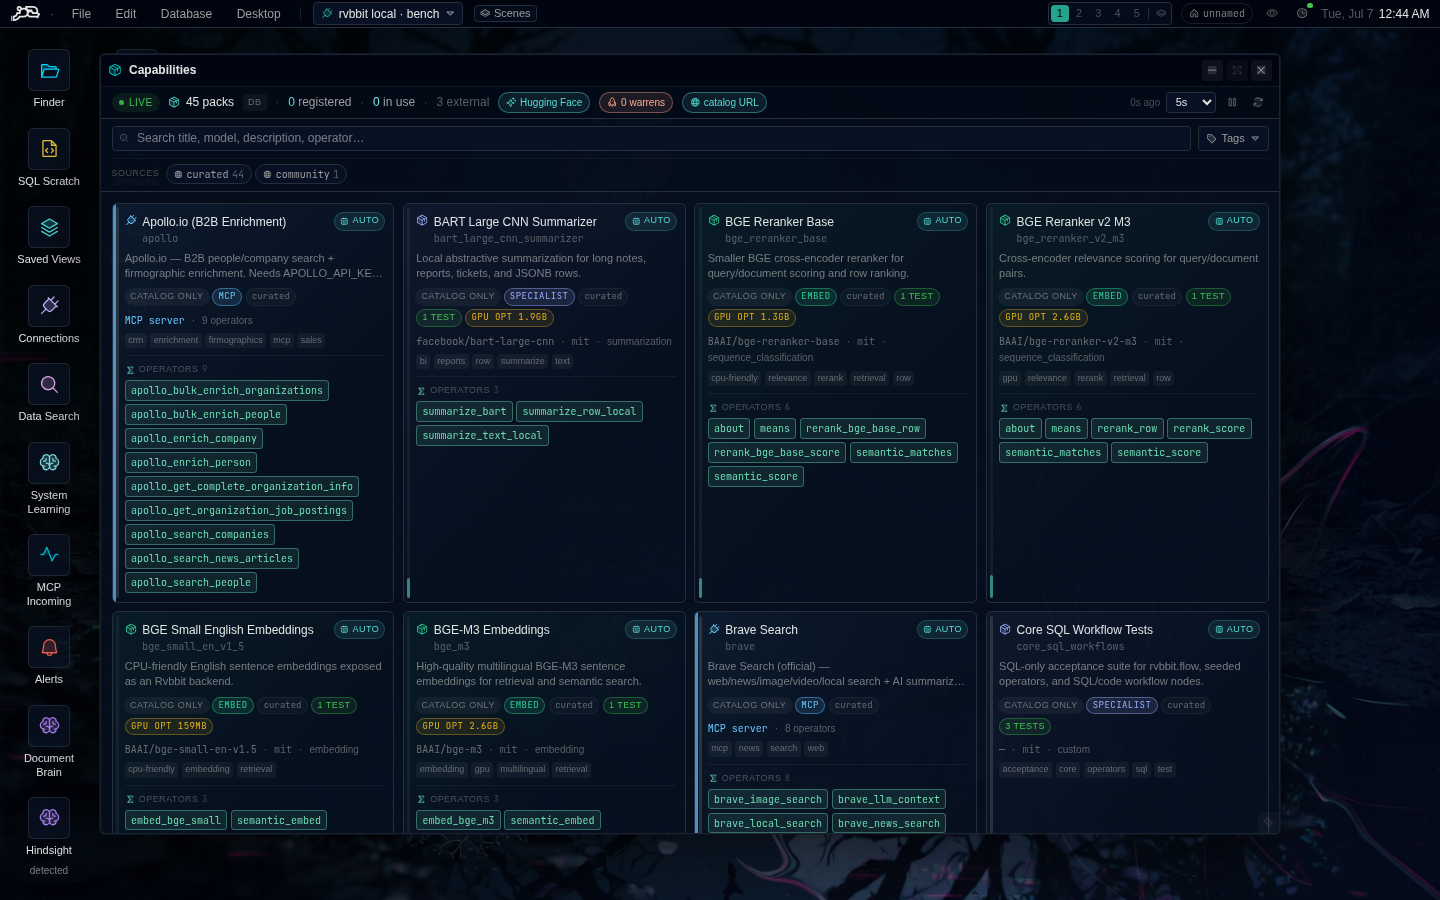
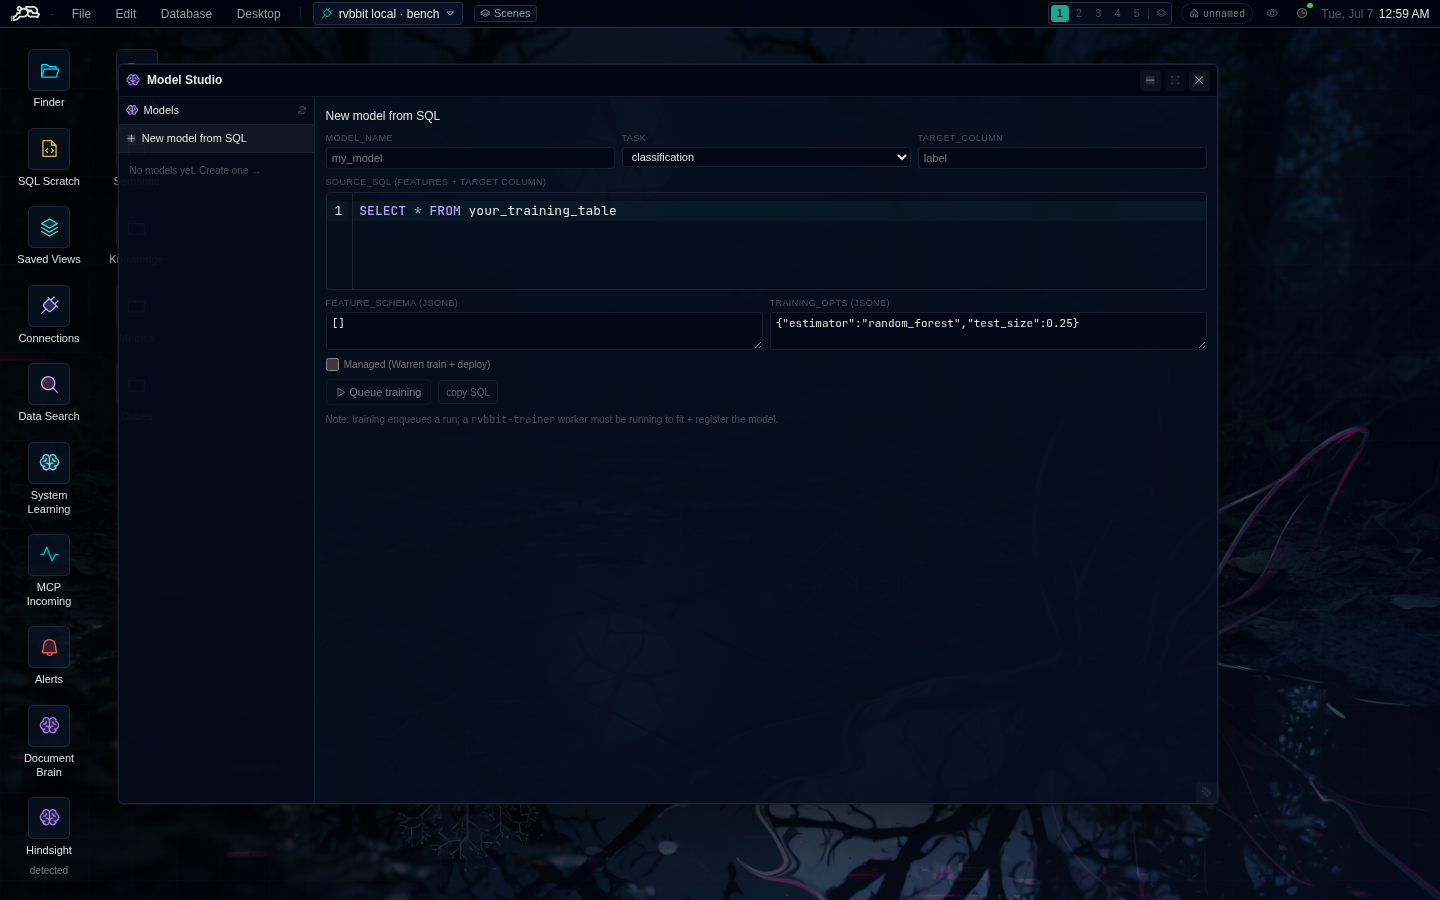
The point of an integrated system isn’t a longer feature list — it’s that the pieces start cooperating on their own. From real deployments, lightly anonymized.
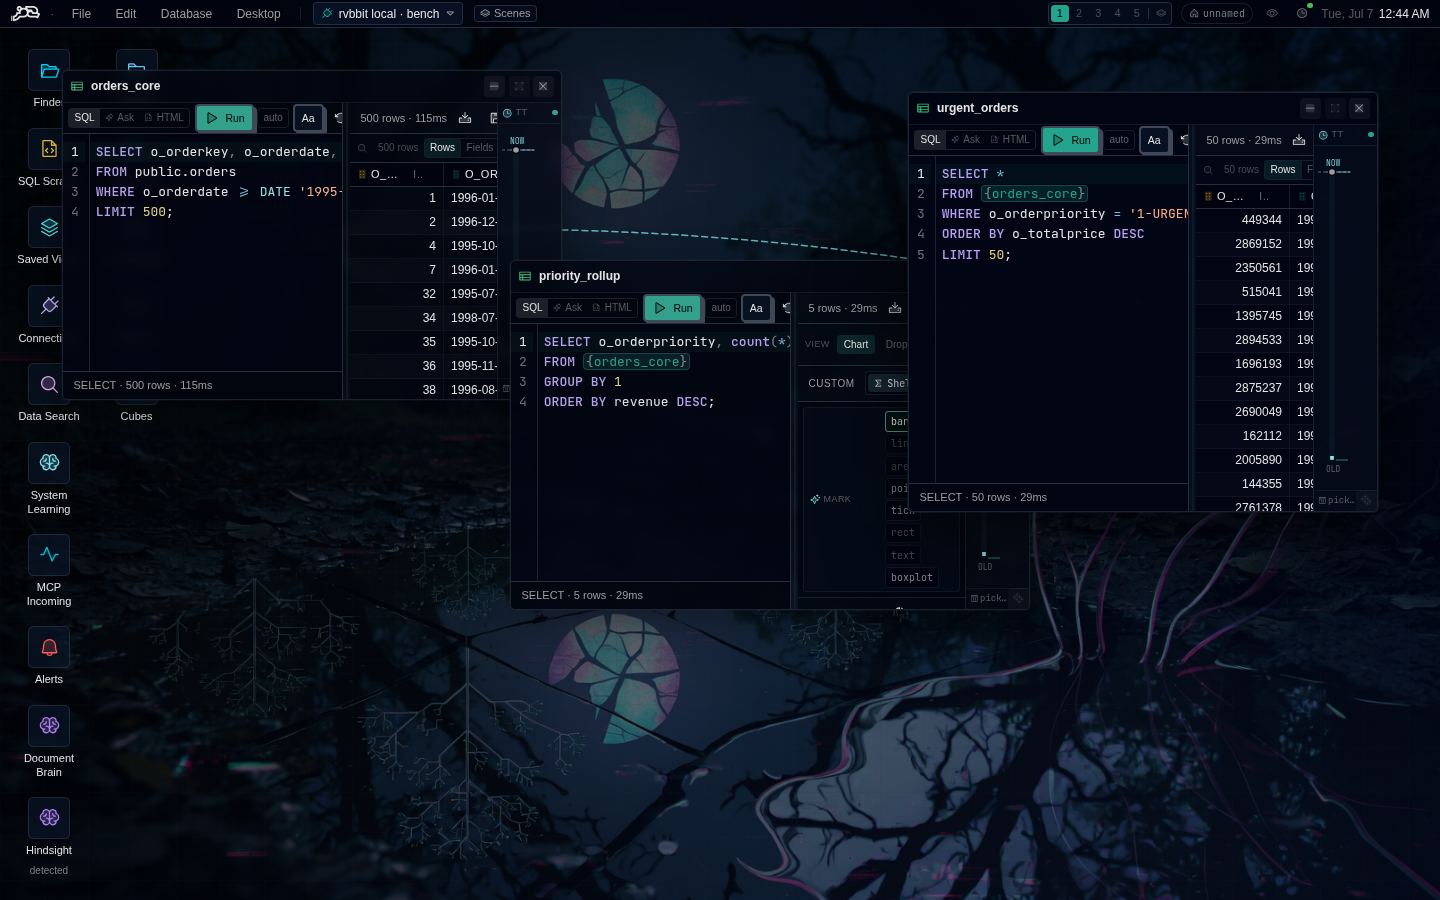
“Oh — someone on your team built something similar yesterday. Want to start from theirs?”
An analyst was sketching a dashboard when the assistant volunteered a colleague’s work from the day before. Nobody programmed that behavior.
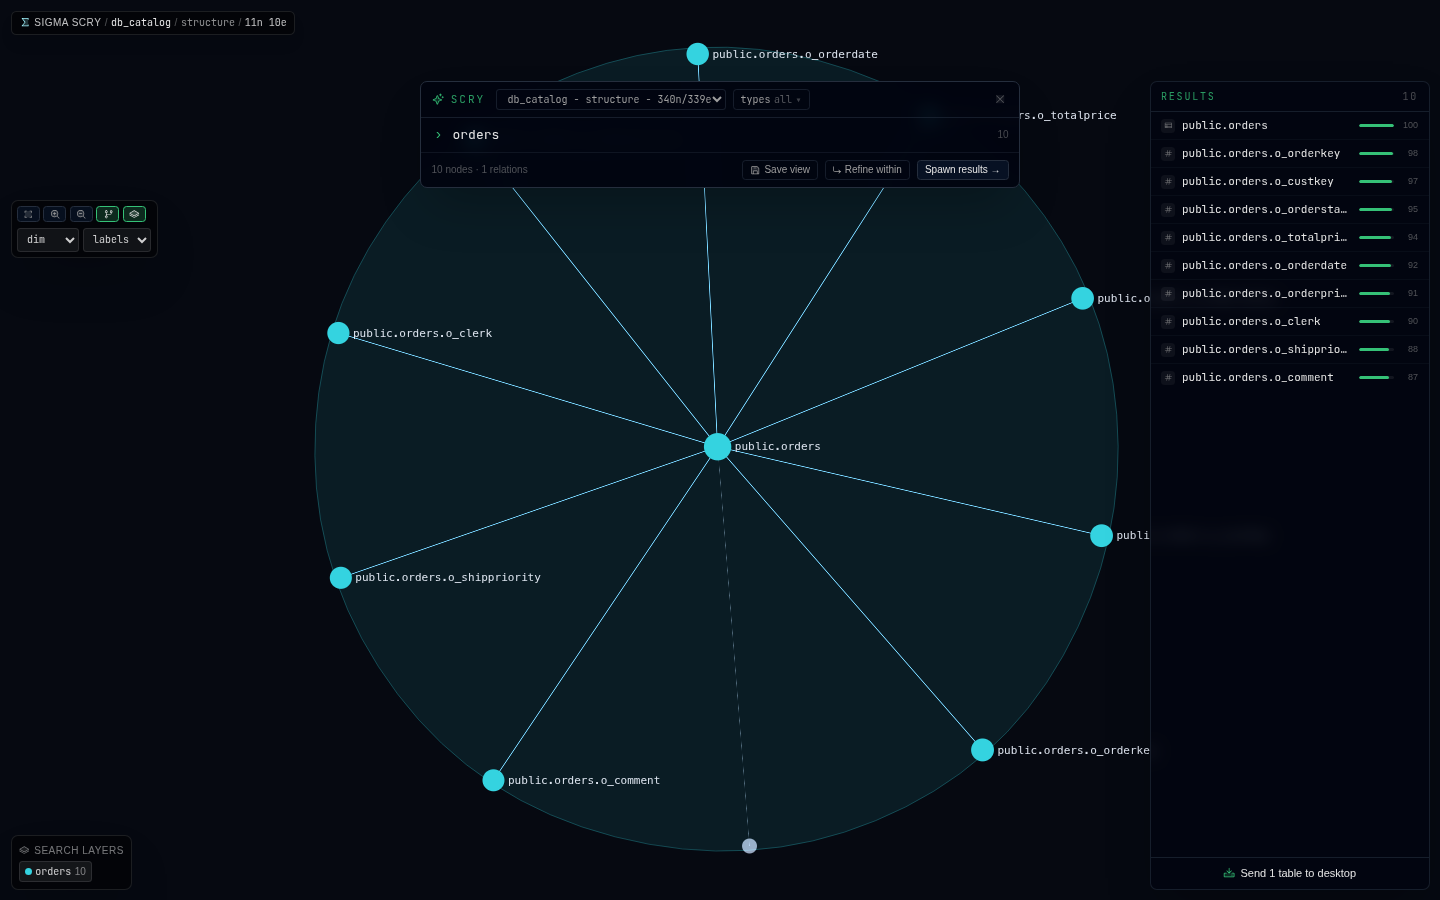
memory × catalog × receipts
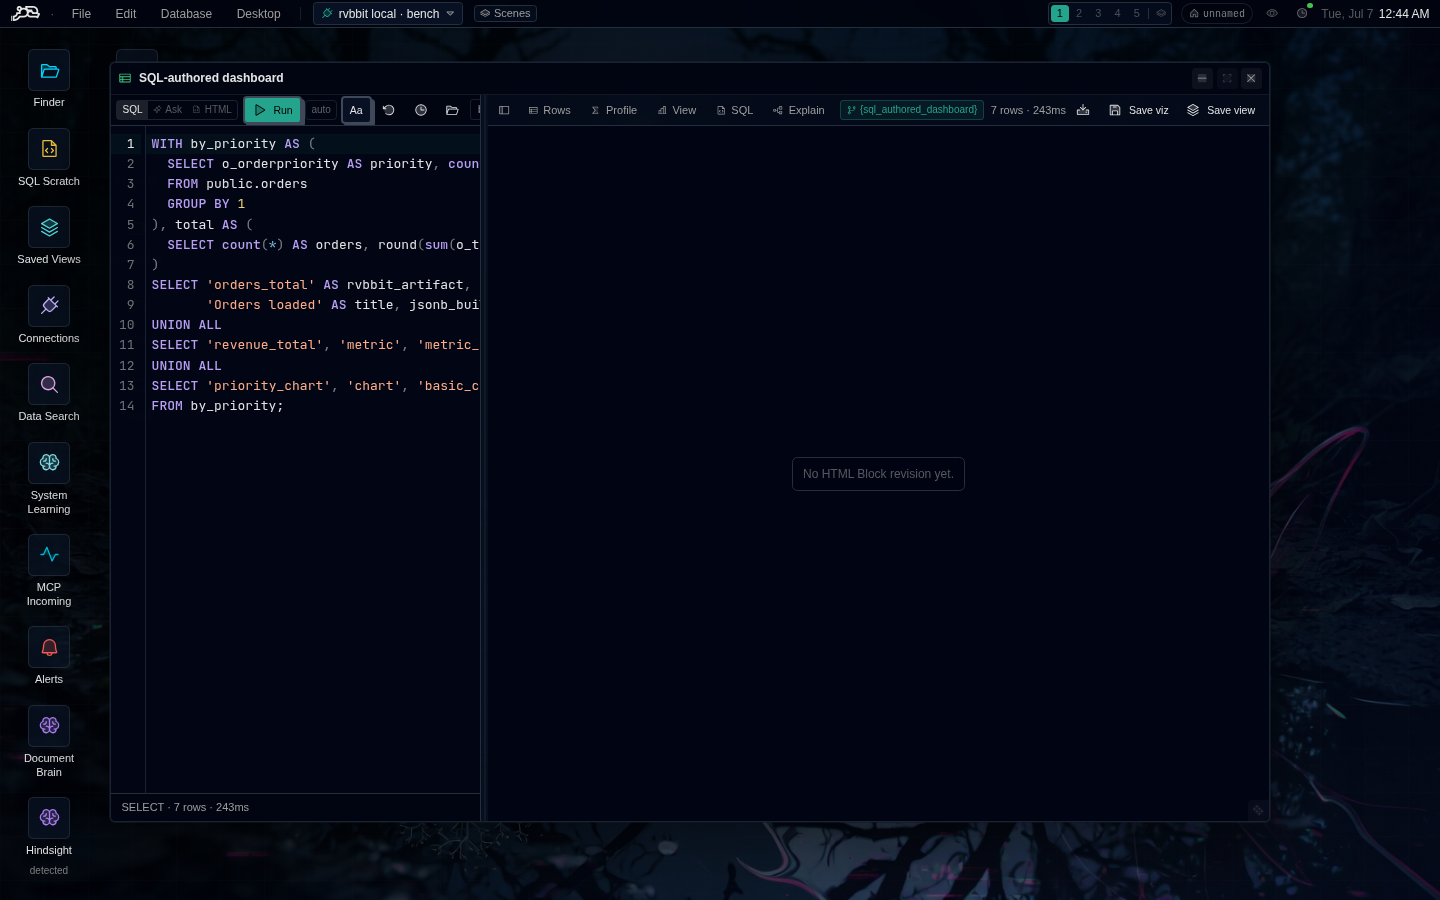
WHERE the witness statement sounds like a hoax
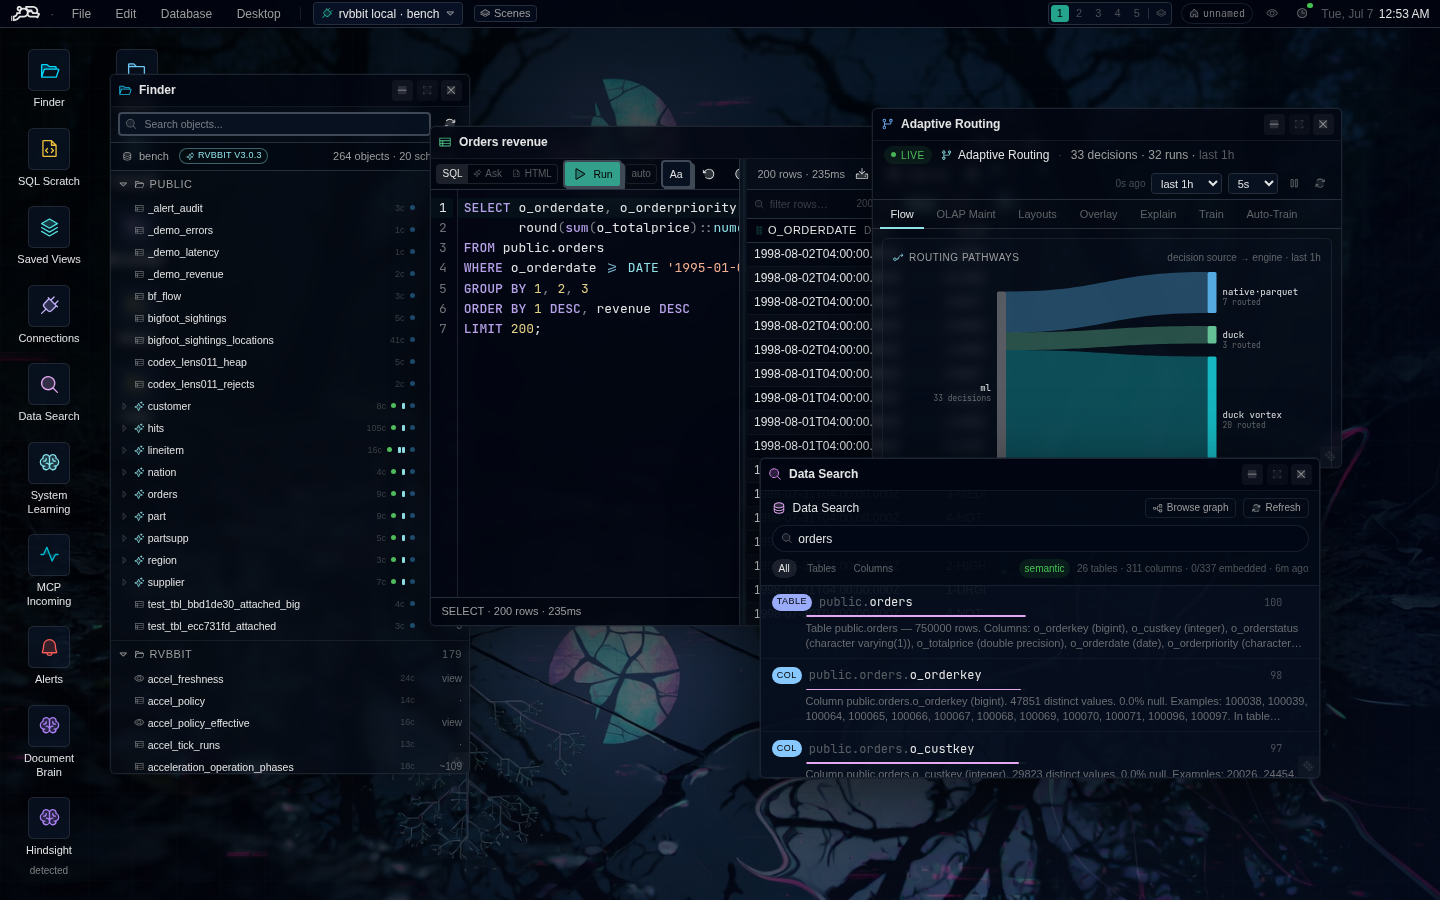
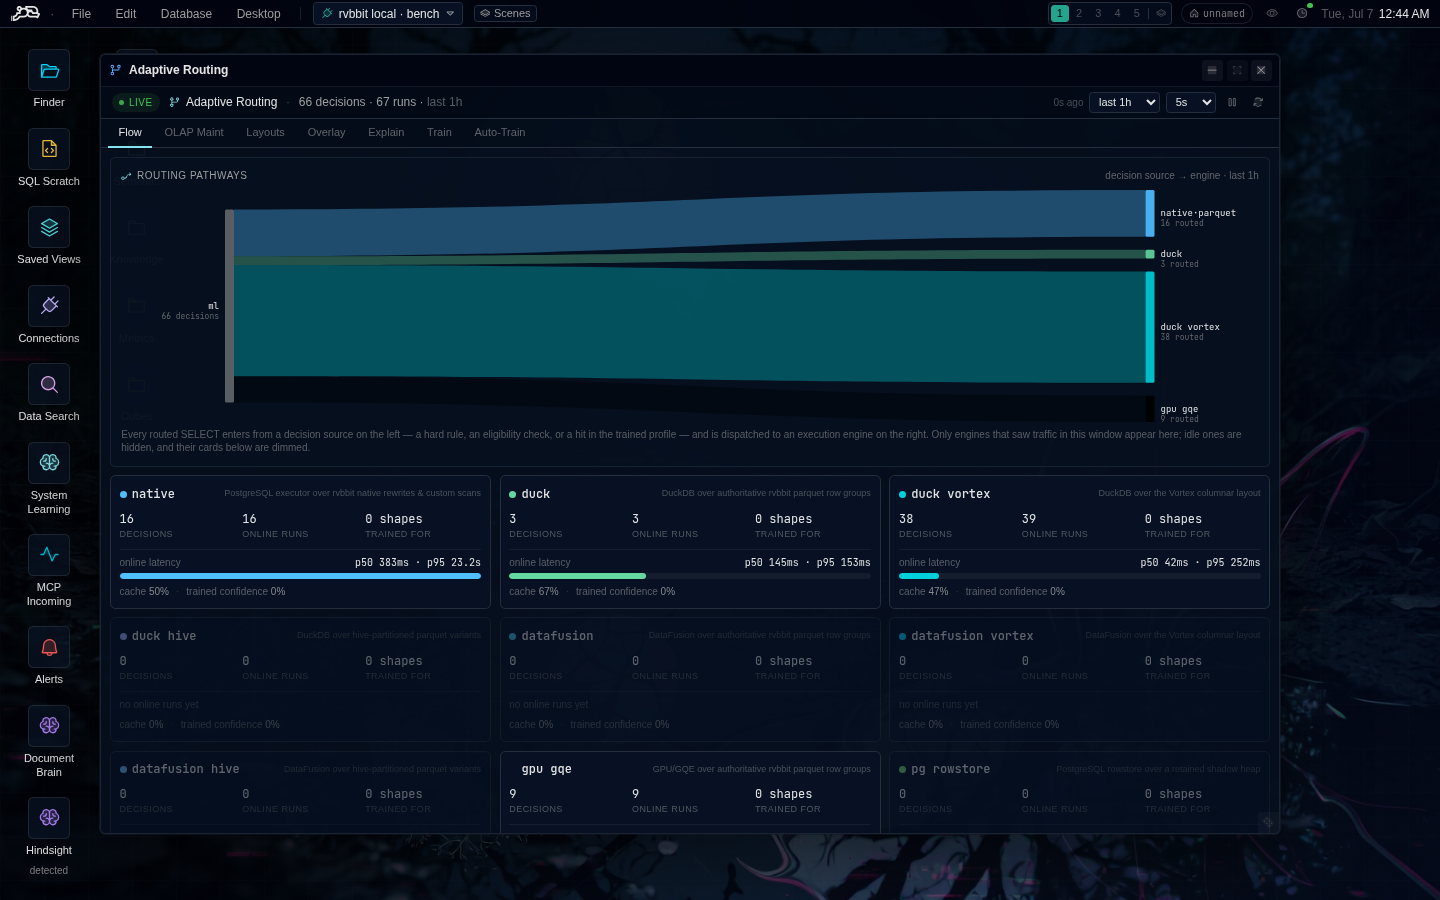
A WHERE clause that reads five thousand free-text reports and takes a position on each one — batched on GPUs, cached, and receipted, in one query.
semantic ops × acceleration × receipts
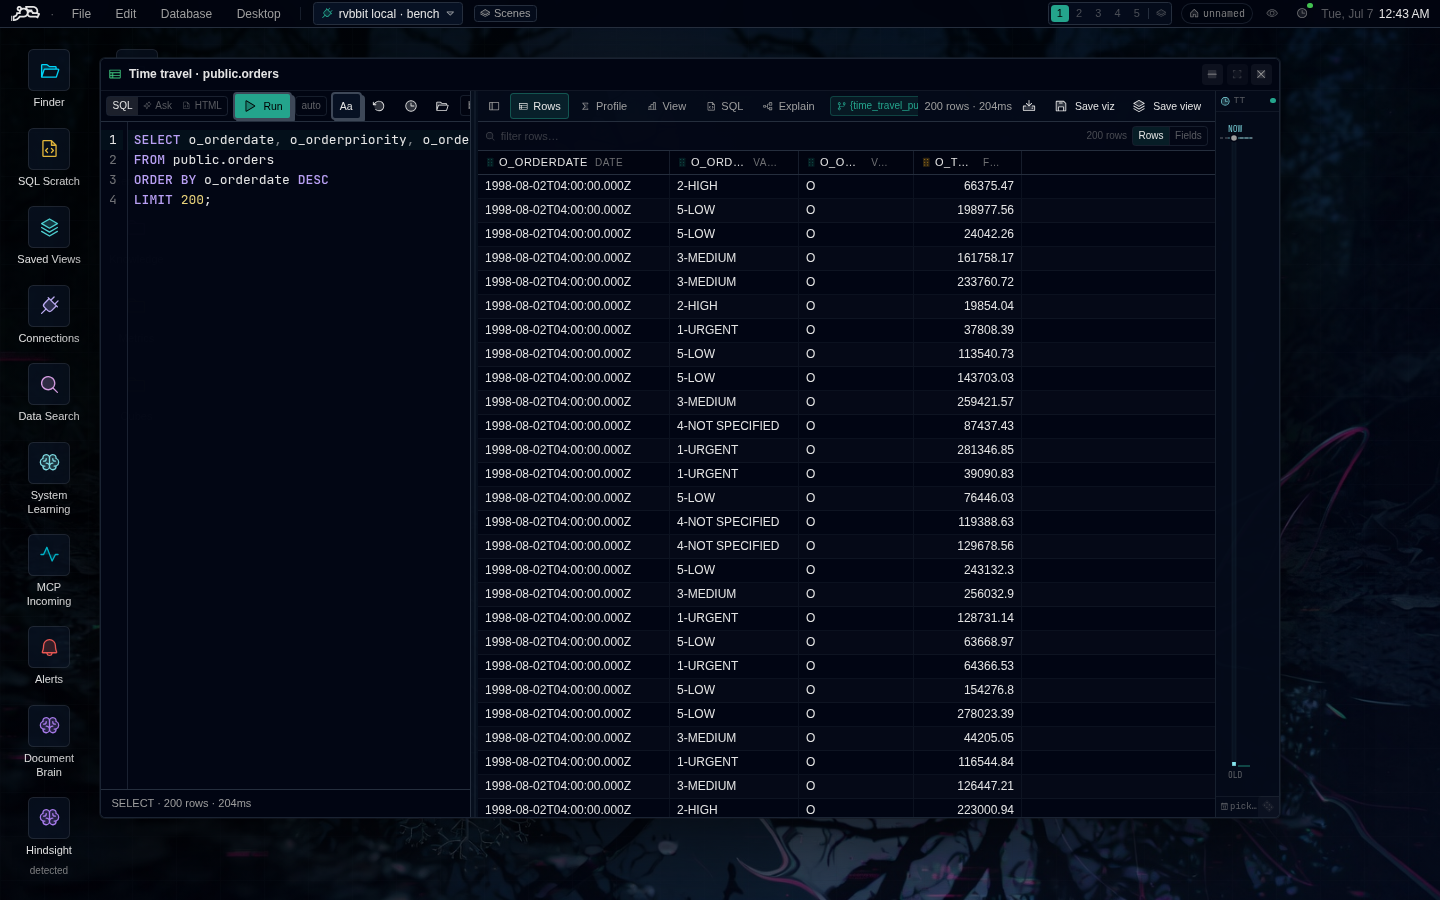
“The metric moved overnight. I diffed the table against yesterday before my coffee was done.”
Time travel isn’t a backup feature — it’s an argument-settling feature. Scrub back, diff, paste the offending rows into standup.
time travel × metrics × the scrubber