
How to get up and running with a ClojureScript "visual REPL" experience in Rabbit. I'm going to try and lay out the minimal interface basics here to get started.
Note: This assumes some Clojure(Script) knowledge - if you are new to the language I'm launching an interactive "Hello Alice: Learn Clojure with Rabbit" series in a few months that will use the interface to guide you through the language, it's various patterns, and all it's Reactive Lisp-y joy.
This document is a work-in-progress!
No need to download, install, or run anything - we're going to do this all here on the web with my hosted version. Ok, let's get started!
Open up an (almost) empty flow. This will be our starting canvas, URL below.
https://app.datarabbit.com/#/new/howdy/client-side-block
please paste it, Ghost ruins my URLs w ?ref=garbage when I link it 😠
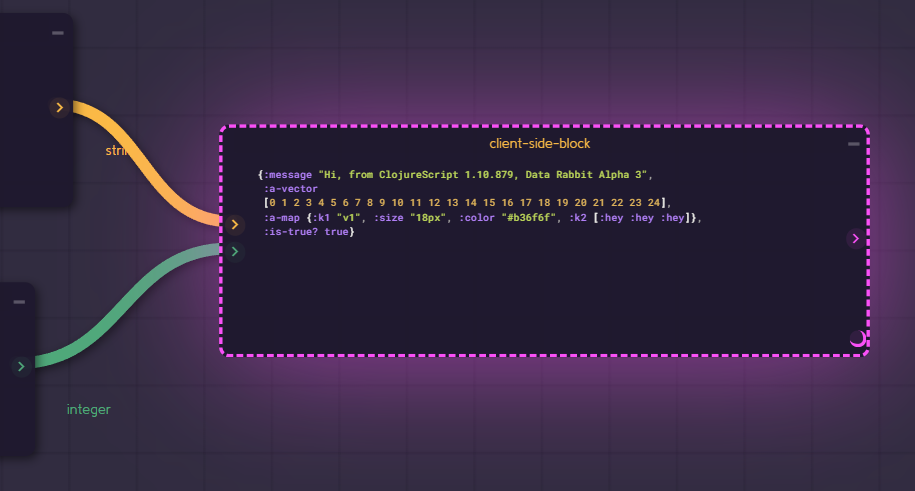
Once everything is booted up in your browser the panel on the left will show some orange text displaying the ClojureScript version and Rabbit version.
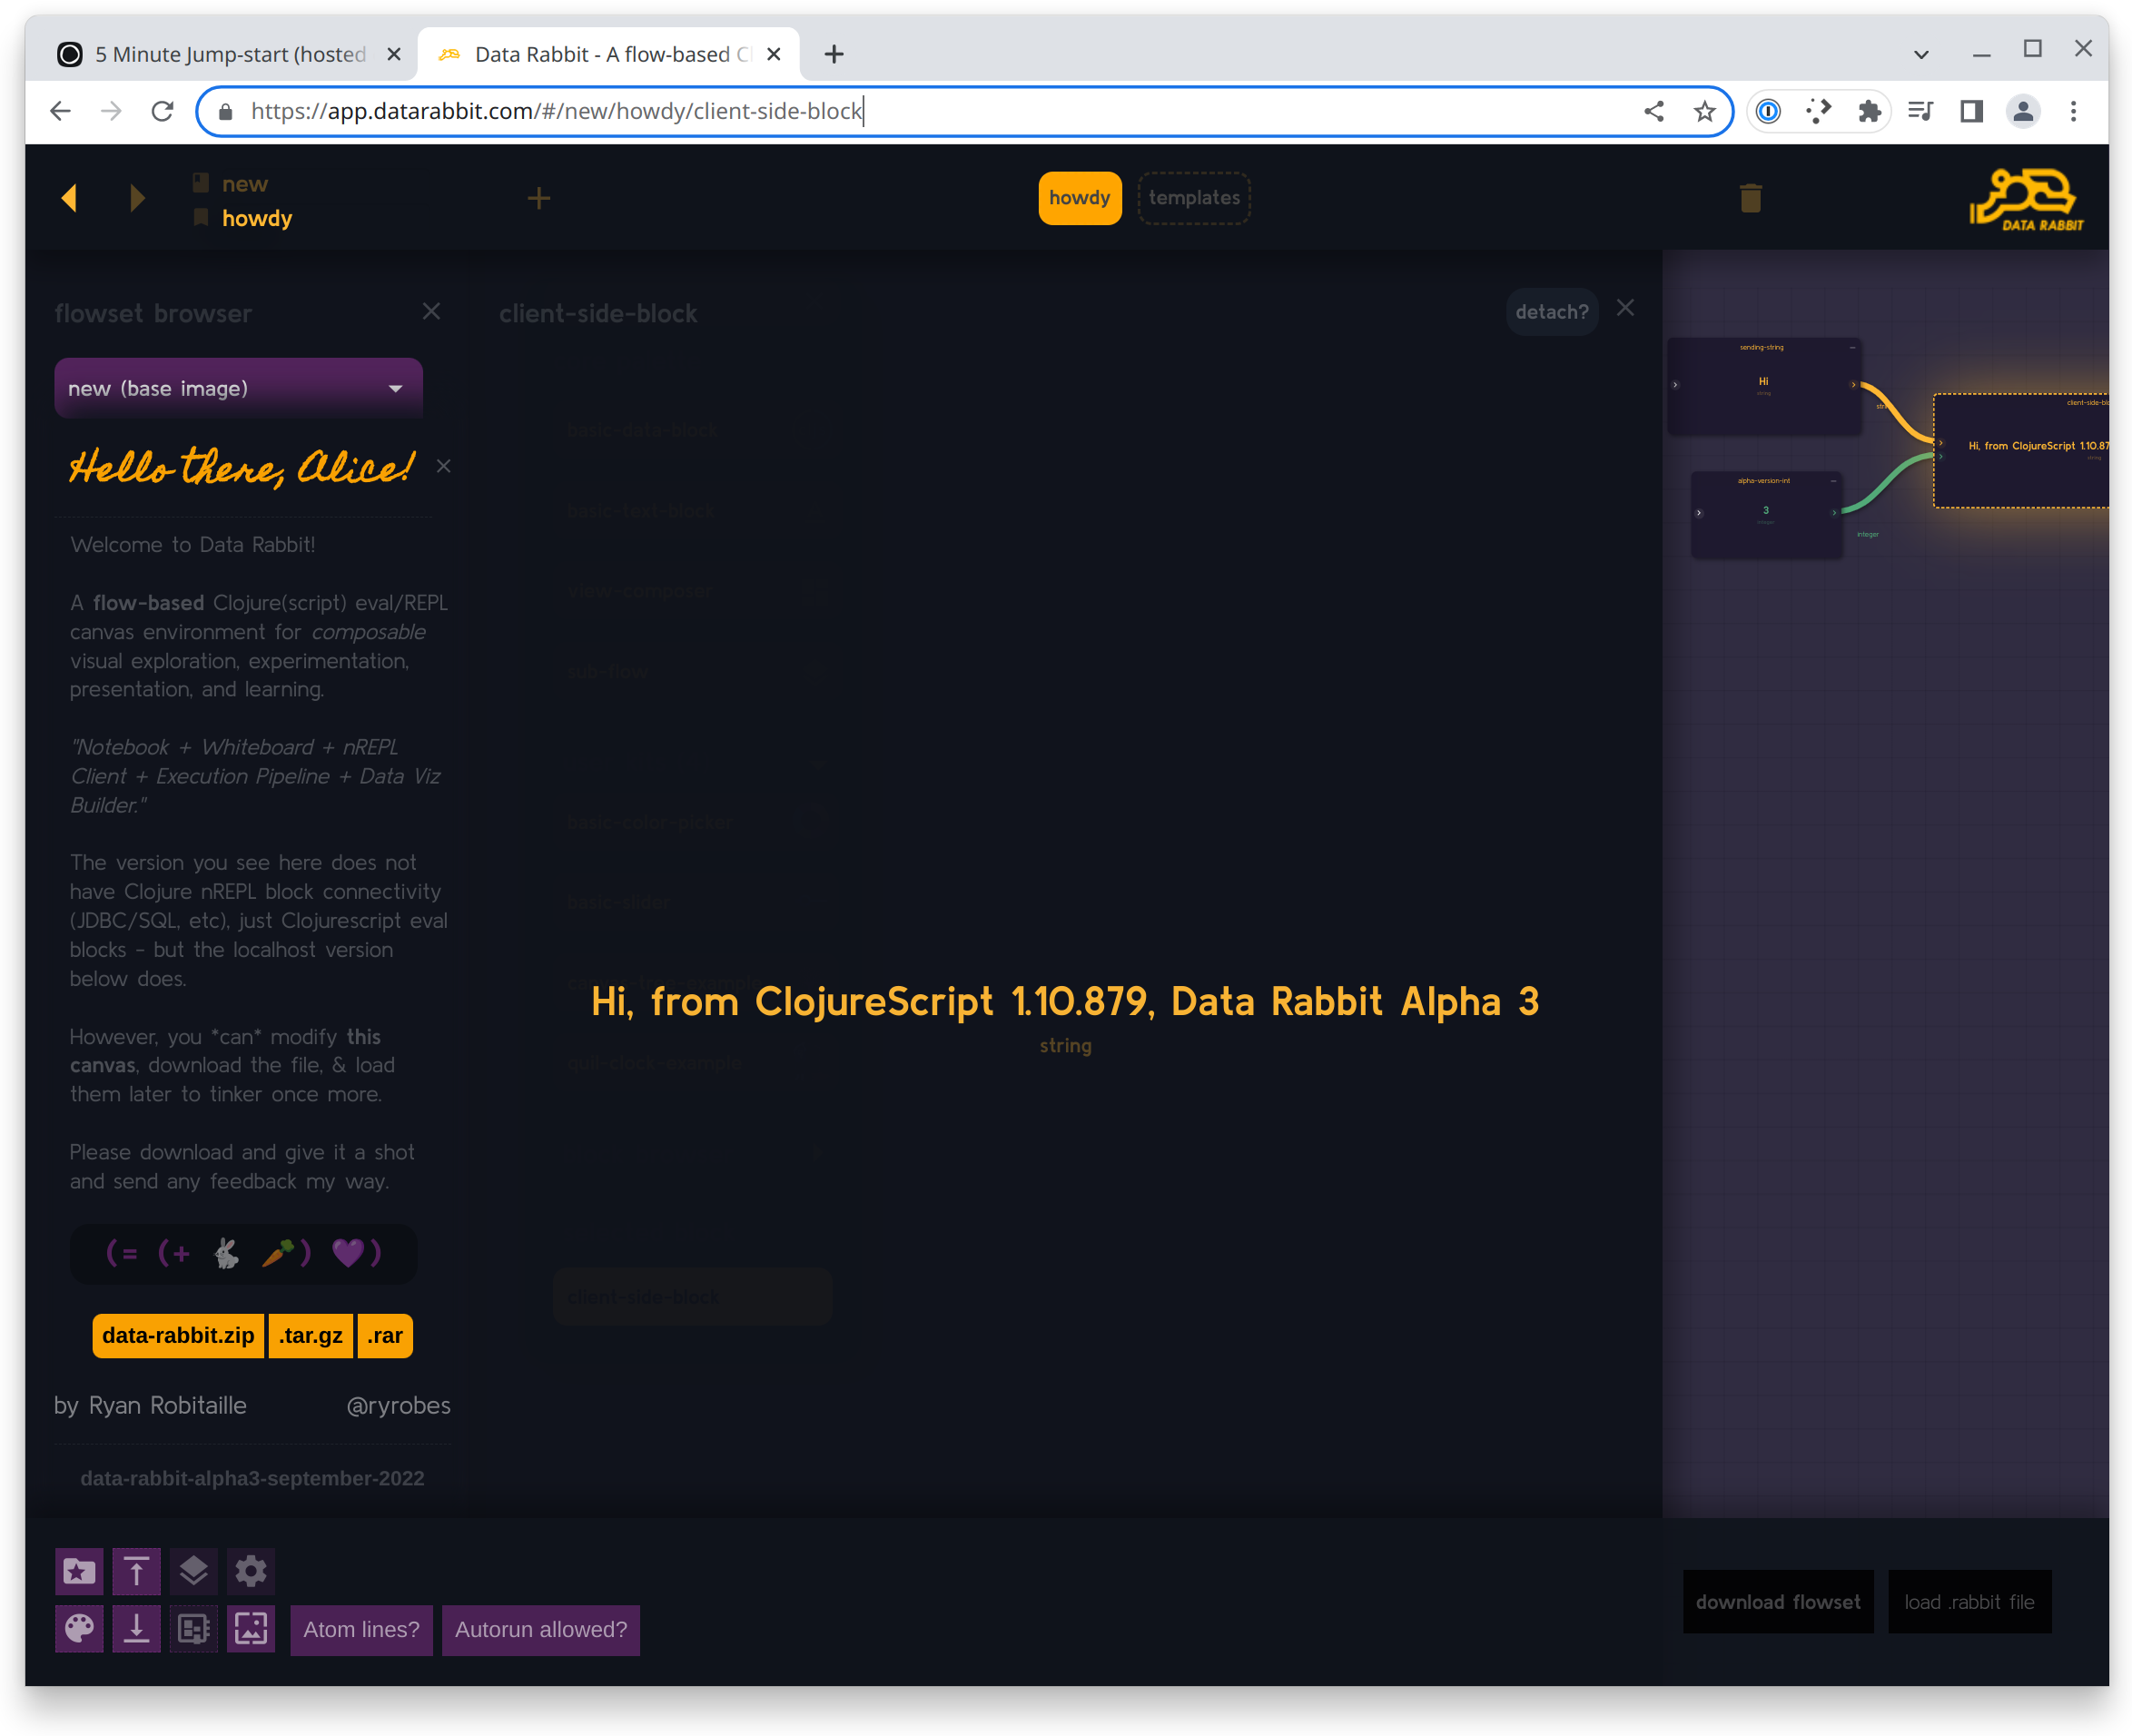
Let's close some of these panels that we don't need at the moment. The large one in the middle is the Preview Panel - it shows the current configured output of the selected block (in this case its the text output of client-side-block since I included it in the URL).
There are 3 ways to close it:
- Hit the X at the top right corner
- Hit Shift-F (can also be used to toggle back on)
- Click the button on the lower right panel that looks like a picture frame (can also be used to toggle back on)
Close the Browser Panel - it's the narrow one on the far left. This panel is mostly used for browsing local Rabbit flow files on your machine / server when Rabbit is running locally.
There are 3 ways to close it also:
- Hit the X at the top right corner
- Hit Shift-Q (can also be used to toggle back on)
- Click the button on the lower right panel that looks like a folder with a star on it (can also be used to toggle back on)
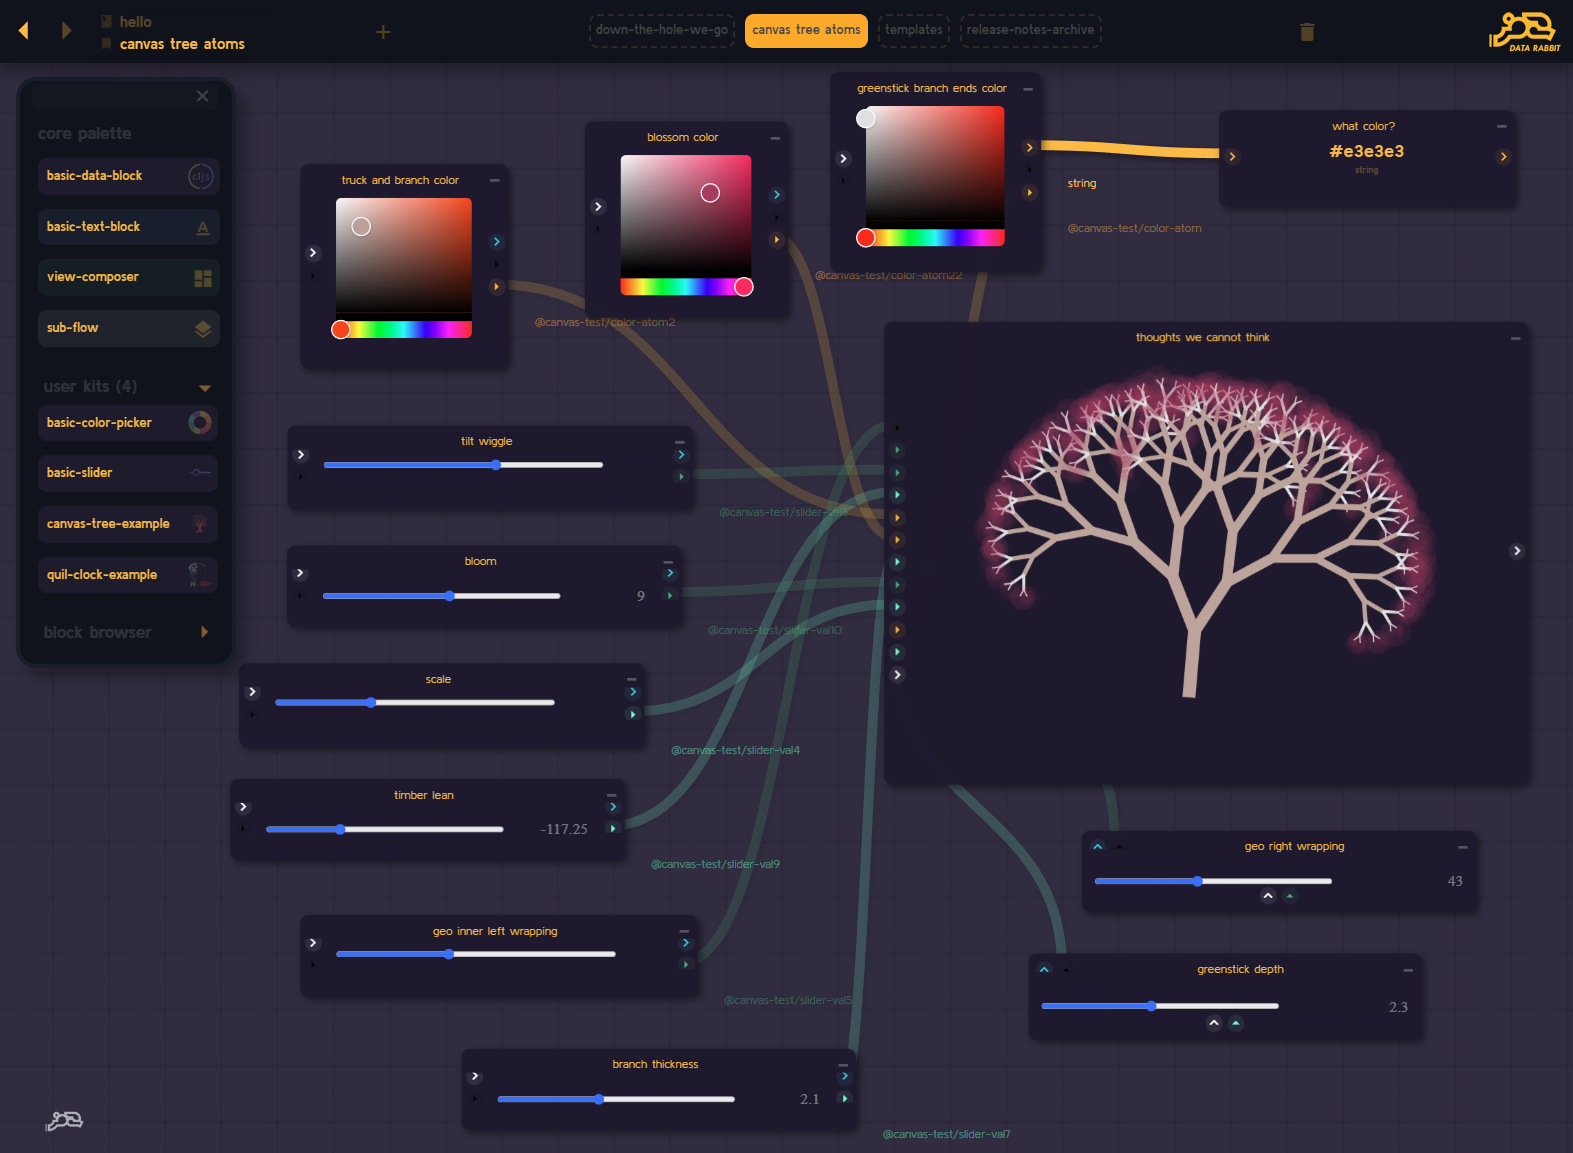
You should now be looking at a flow canvas with 3 panels remaining
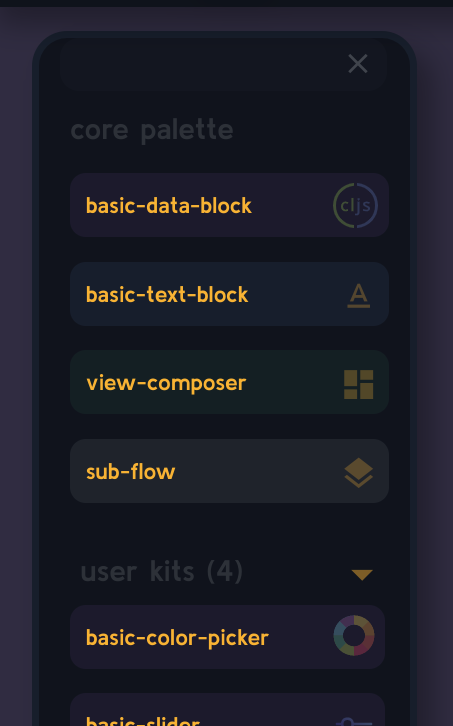
- The Block Palette - used for dragging new blocks on to the canvas (toggled with Shift-A), lets keep it on for now.
- The top Flow Bar - mostly used for navigating to new flows, renaming / creating / deleting flows (toggled with Shift-W), lets leave it on for now.

- The bottom Button Bar - is for, well, buttons - such as panel hotkeys, saving, loading, etc (toggled with Shift-S), feel free to hide or keep it depending on how much screen real estate you have available.

(don't worry if you hide it and get lost later - a small Rabbit icon will take it's place and clicking on it will bring it back)
Center and Zoom the canvas on the current existing blocks. Think of a block as a single REPL eval environment. It can send and receive data with other blocks, but works find on it's own as well.
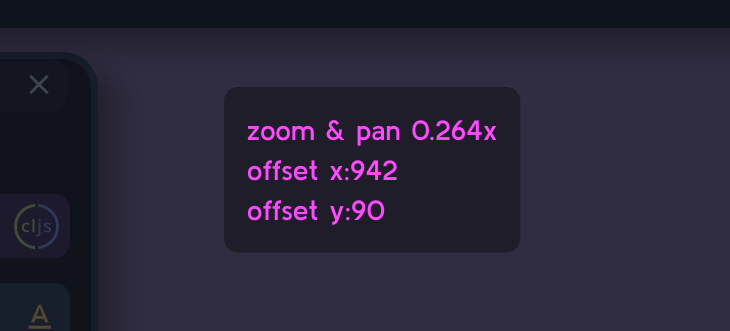
Hit Spacebar to go into Pan / Zoom mode. You'll know that you are in this mode since a floating box will appear in the upper left giving some stats on the canvas position and scale.
Use your mouse and drag the 3 blocks to the center of the screen and then use the mouse-wheel to zoom in to a comfortable distance.
Hit Spacebar again to exit Pan / Zoom mode (since we can't interact with anything otherwise).
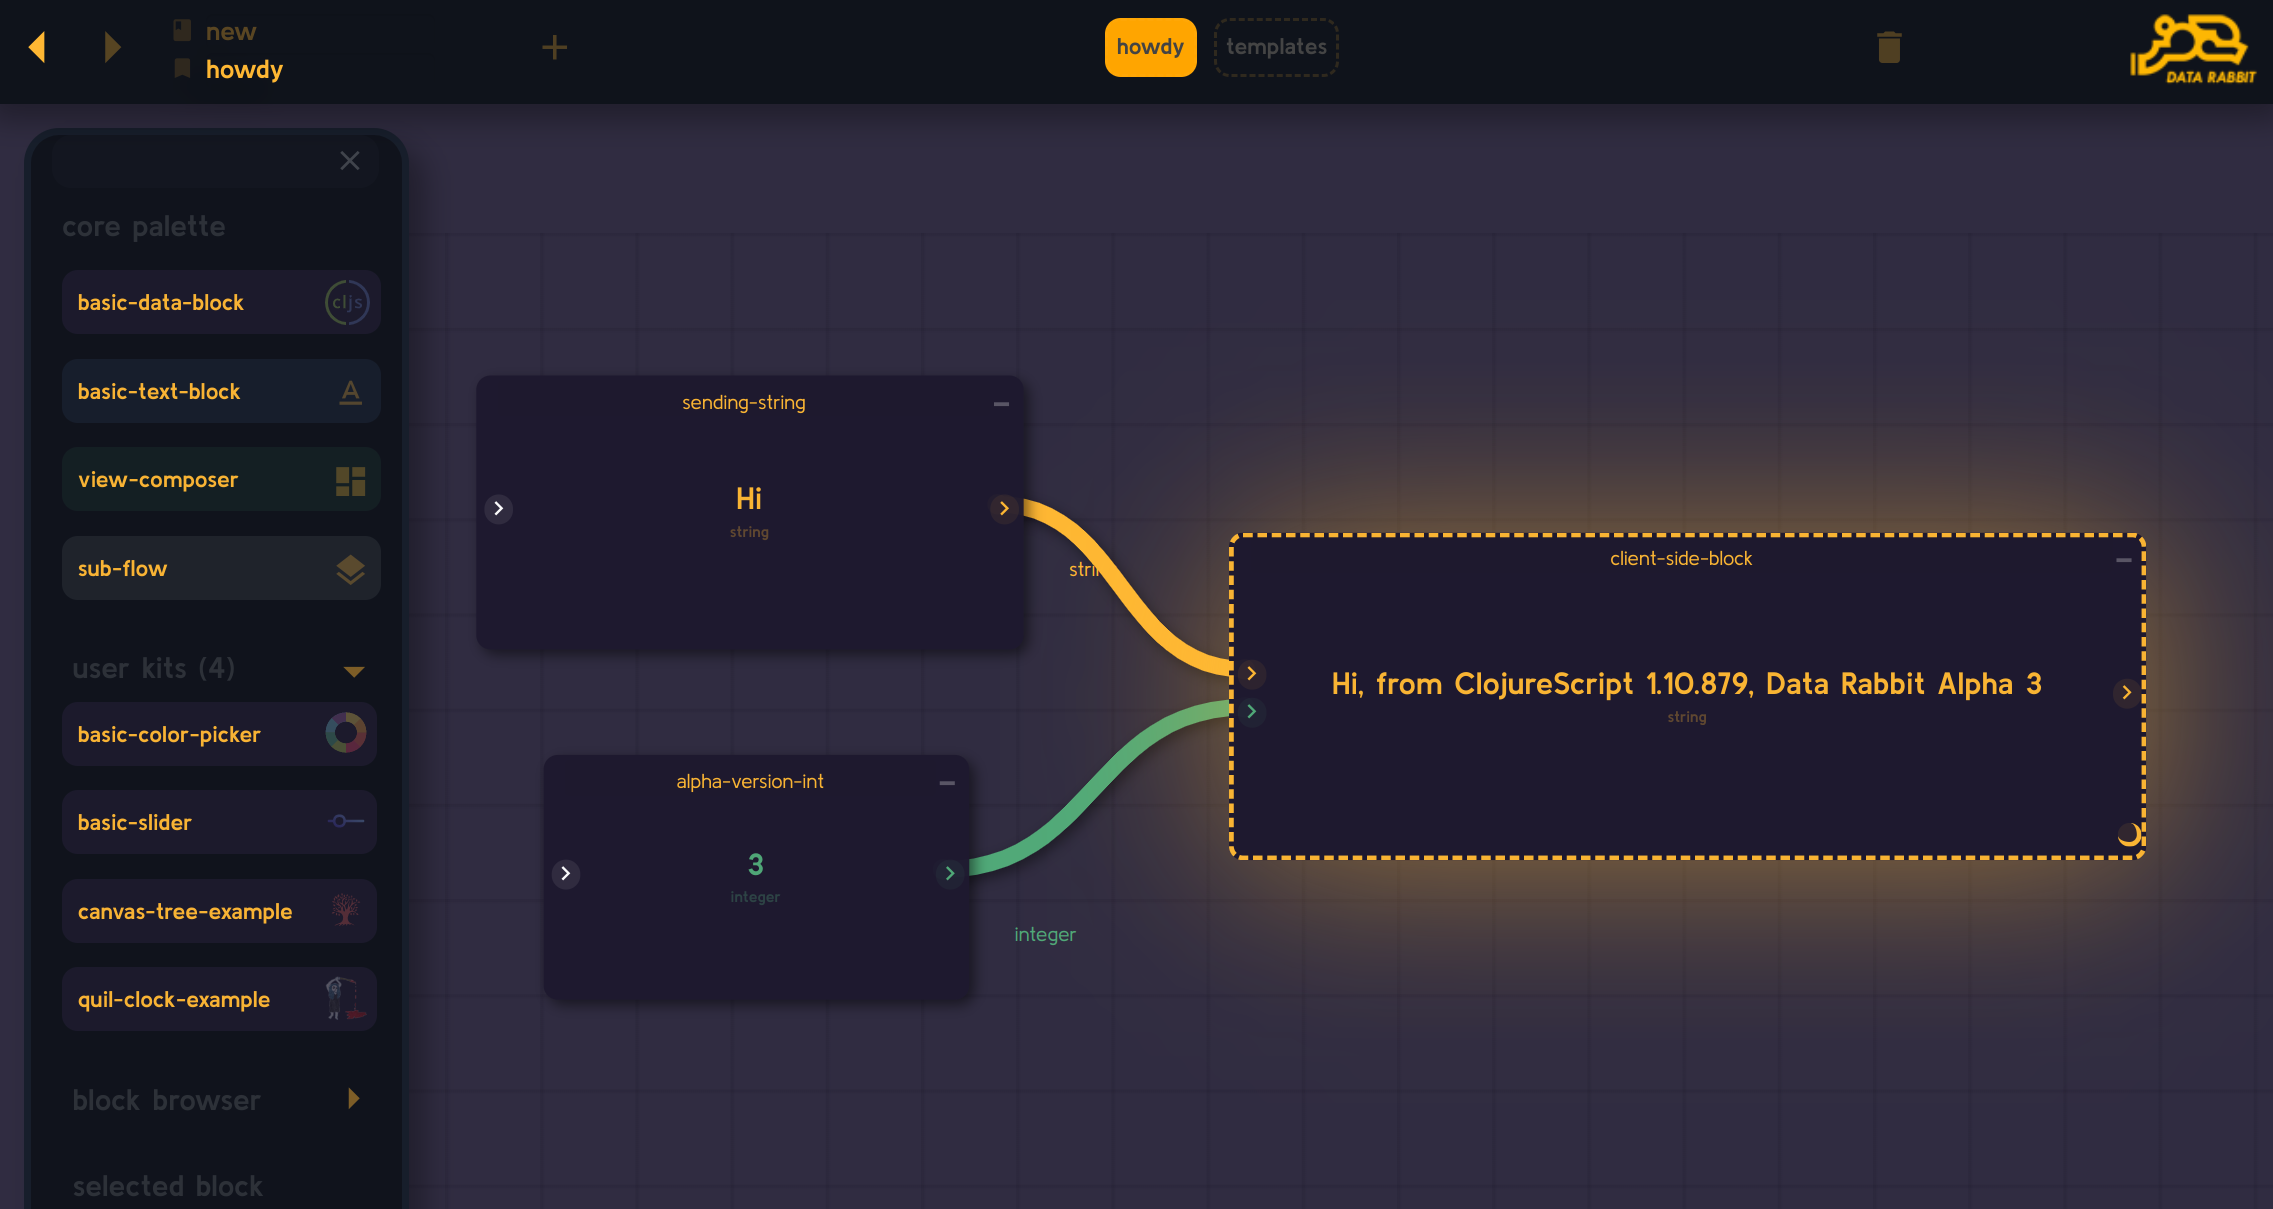
Now, client-side-block should still be selected (notice the yellow dashed outline and glow in my screenshot), if not click on it's title and it will be selected again.
Selected blocks can be dragged around and resized as you see fit - either by dragging the title bar, or dragging the resize handle on the bottom right. Try clicking on the other block's title bars and dragging them around (you can also hit Q and E to cycle through the available blocks in the flow).
When you are ready select the upper left block called sending-string.
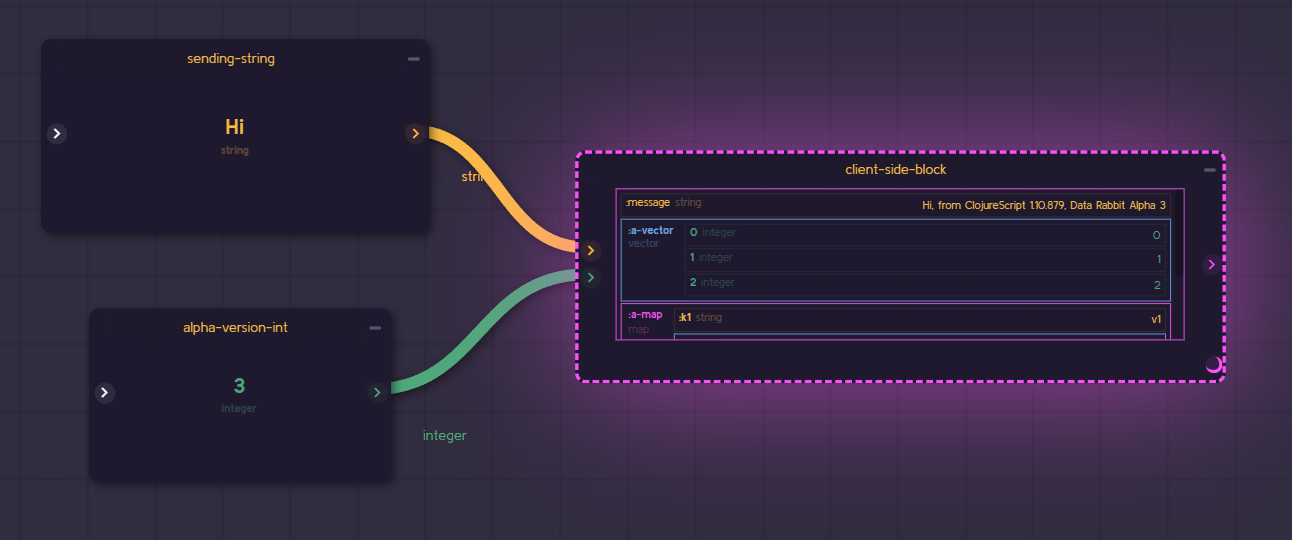
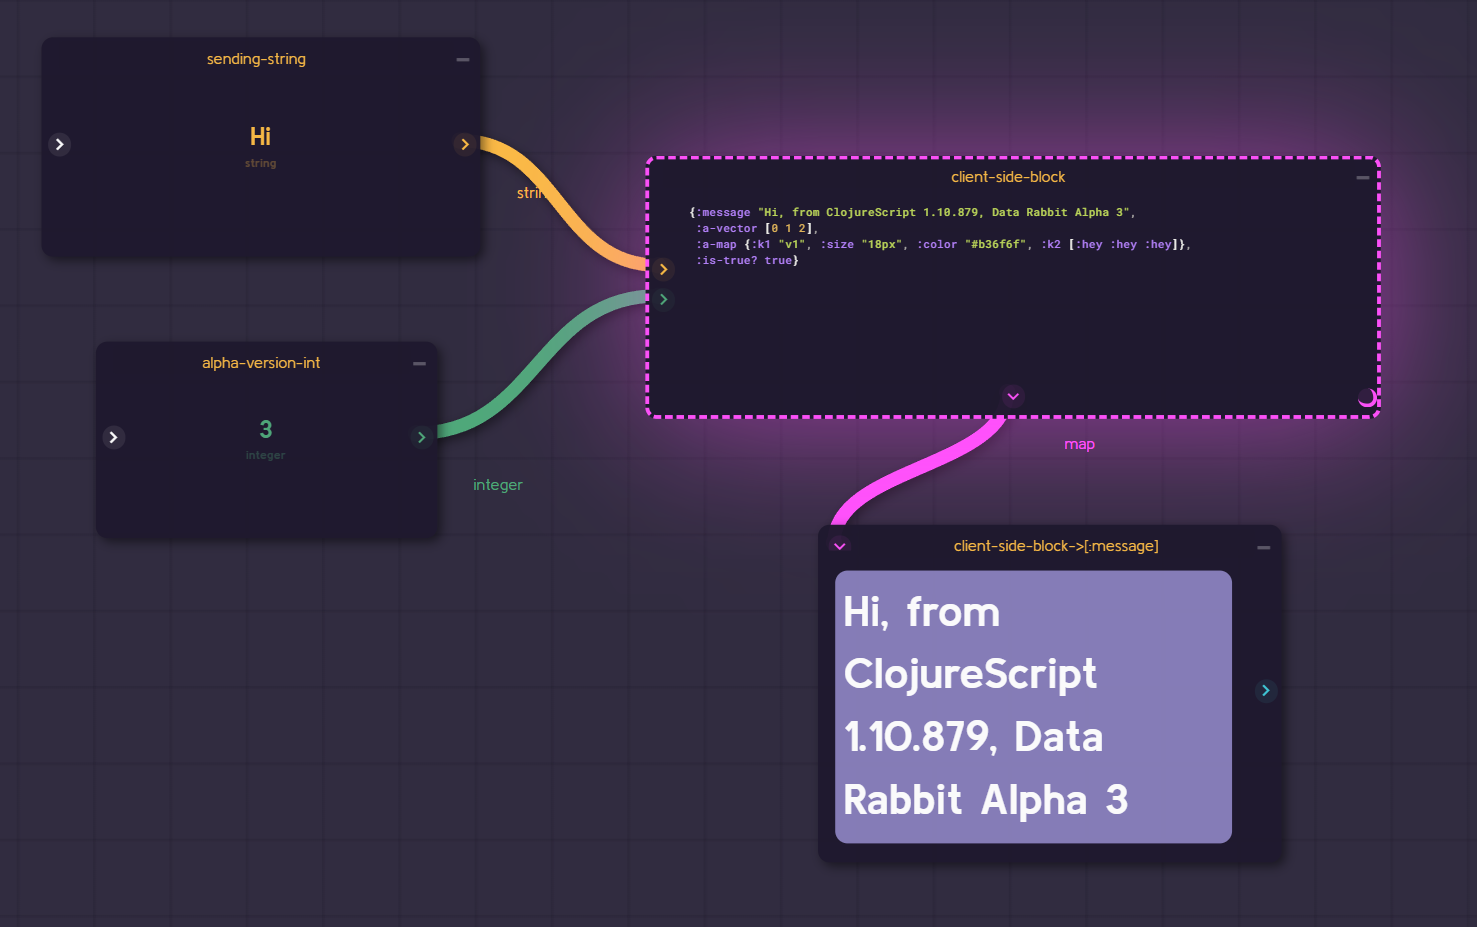
But before we get into block editing and data sending - let's take a quick look at what is even happening here. I know it might be obvious, but bear with me here.
The Hi and the 3 are being generated in 2 separate blocks and then passed into the long block on the right which itself supplies the rest of the string.
Rabbit borrows some high level concepts from something called Flow Based Programming. Invented in the late 1960s by J. Paul Morrison it was meant to add some "visual literacy" to complex software systems by representing data passing as logical boxes and lines instead of (the more opaque) pure code.
This way teams could reason about larger chains of events more easily, and write their code in a contained way that only had to worry about processing inputs and sending outputs - the flow map becomes the heart of the system.
Check out some of his writings on the subject.
Blocks run their own code after they've read all the inputs from the input ports configured. Ports are those little nodes on the left/right of the block (or top/bottom) and denoted with arrows. Regardless of the location: Arrow pointing into the block is an input and when away from the block is the output.
Hit the Tab key so we can see the port names (this toggles the on and off, since they take up lots of space and are rarely needed to be viewed all the time).
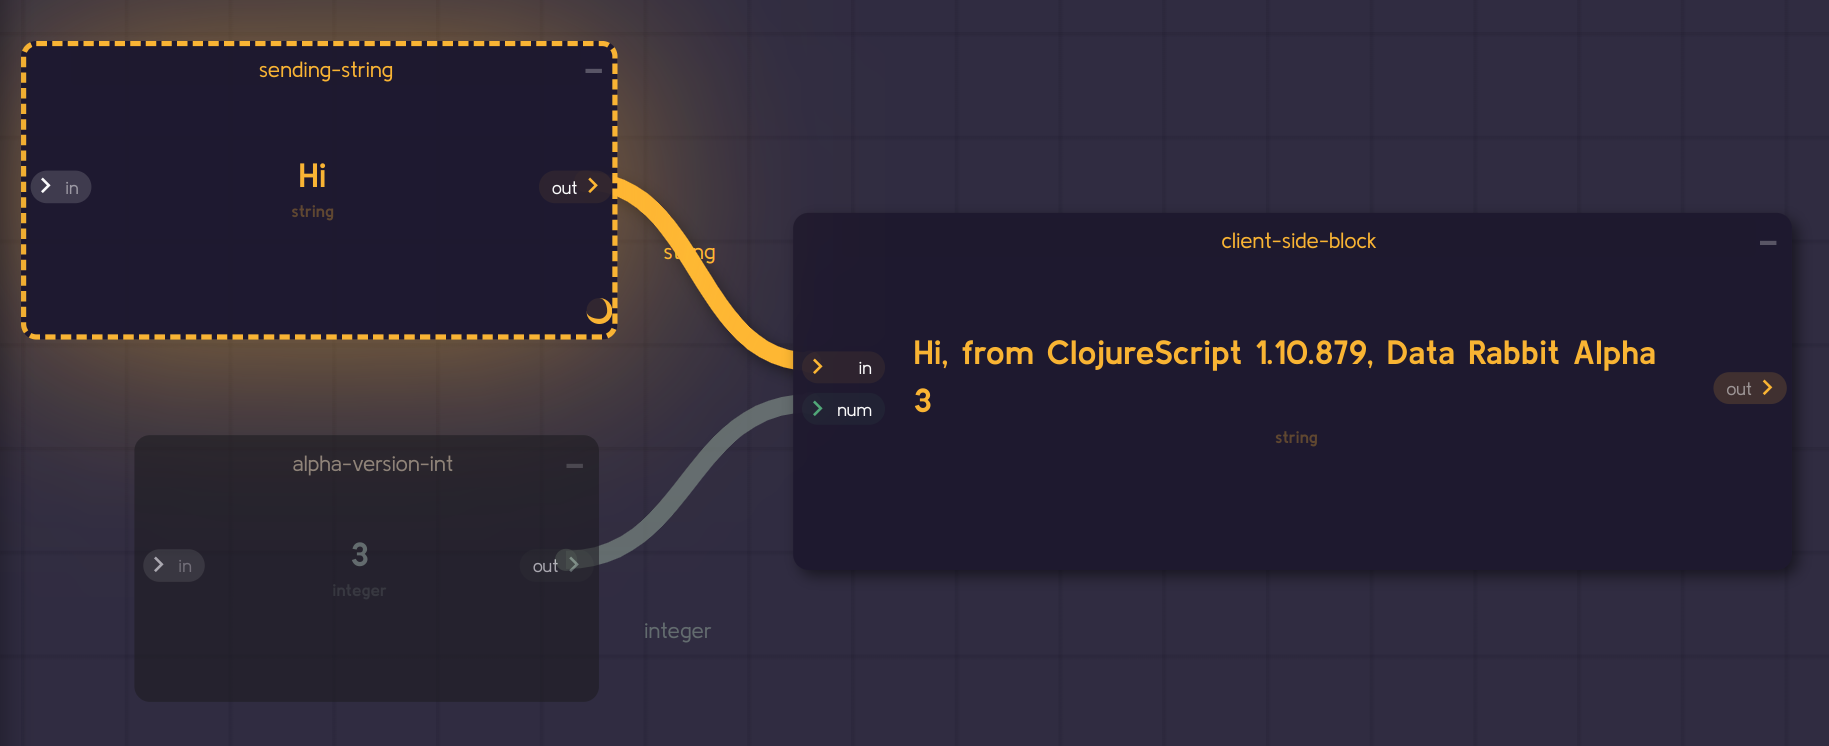
For consistency they are generally named "in" and "out". I know, clever right? But in some cases they may be renamed in the case of multiple inputs. This is the case here, the number 3 is flowing in via a "num" port. Very nice.
Ok, let's hit Tab again to toggle those ugly labels back off and move along.
Again select the client-side-block by clicking on its title bar.
It's time to open the Editor Panel. The editor panel is the main UI for Rabbit next to the canvas itself. You can think of it this way:
- Editor Panel / Blocks - cares about a single blocks code and processing in/out.
- Canvas / Ports / Lines - cares about the orchestration of blocks and controlling the flow of in/out data.
At this point you're probably saying "Yeah, I get it. I get it.". So now with our client-side-block selected lets hit Shift-D and open the editor.
Lot to cover here - but lets do it step by step.
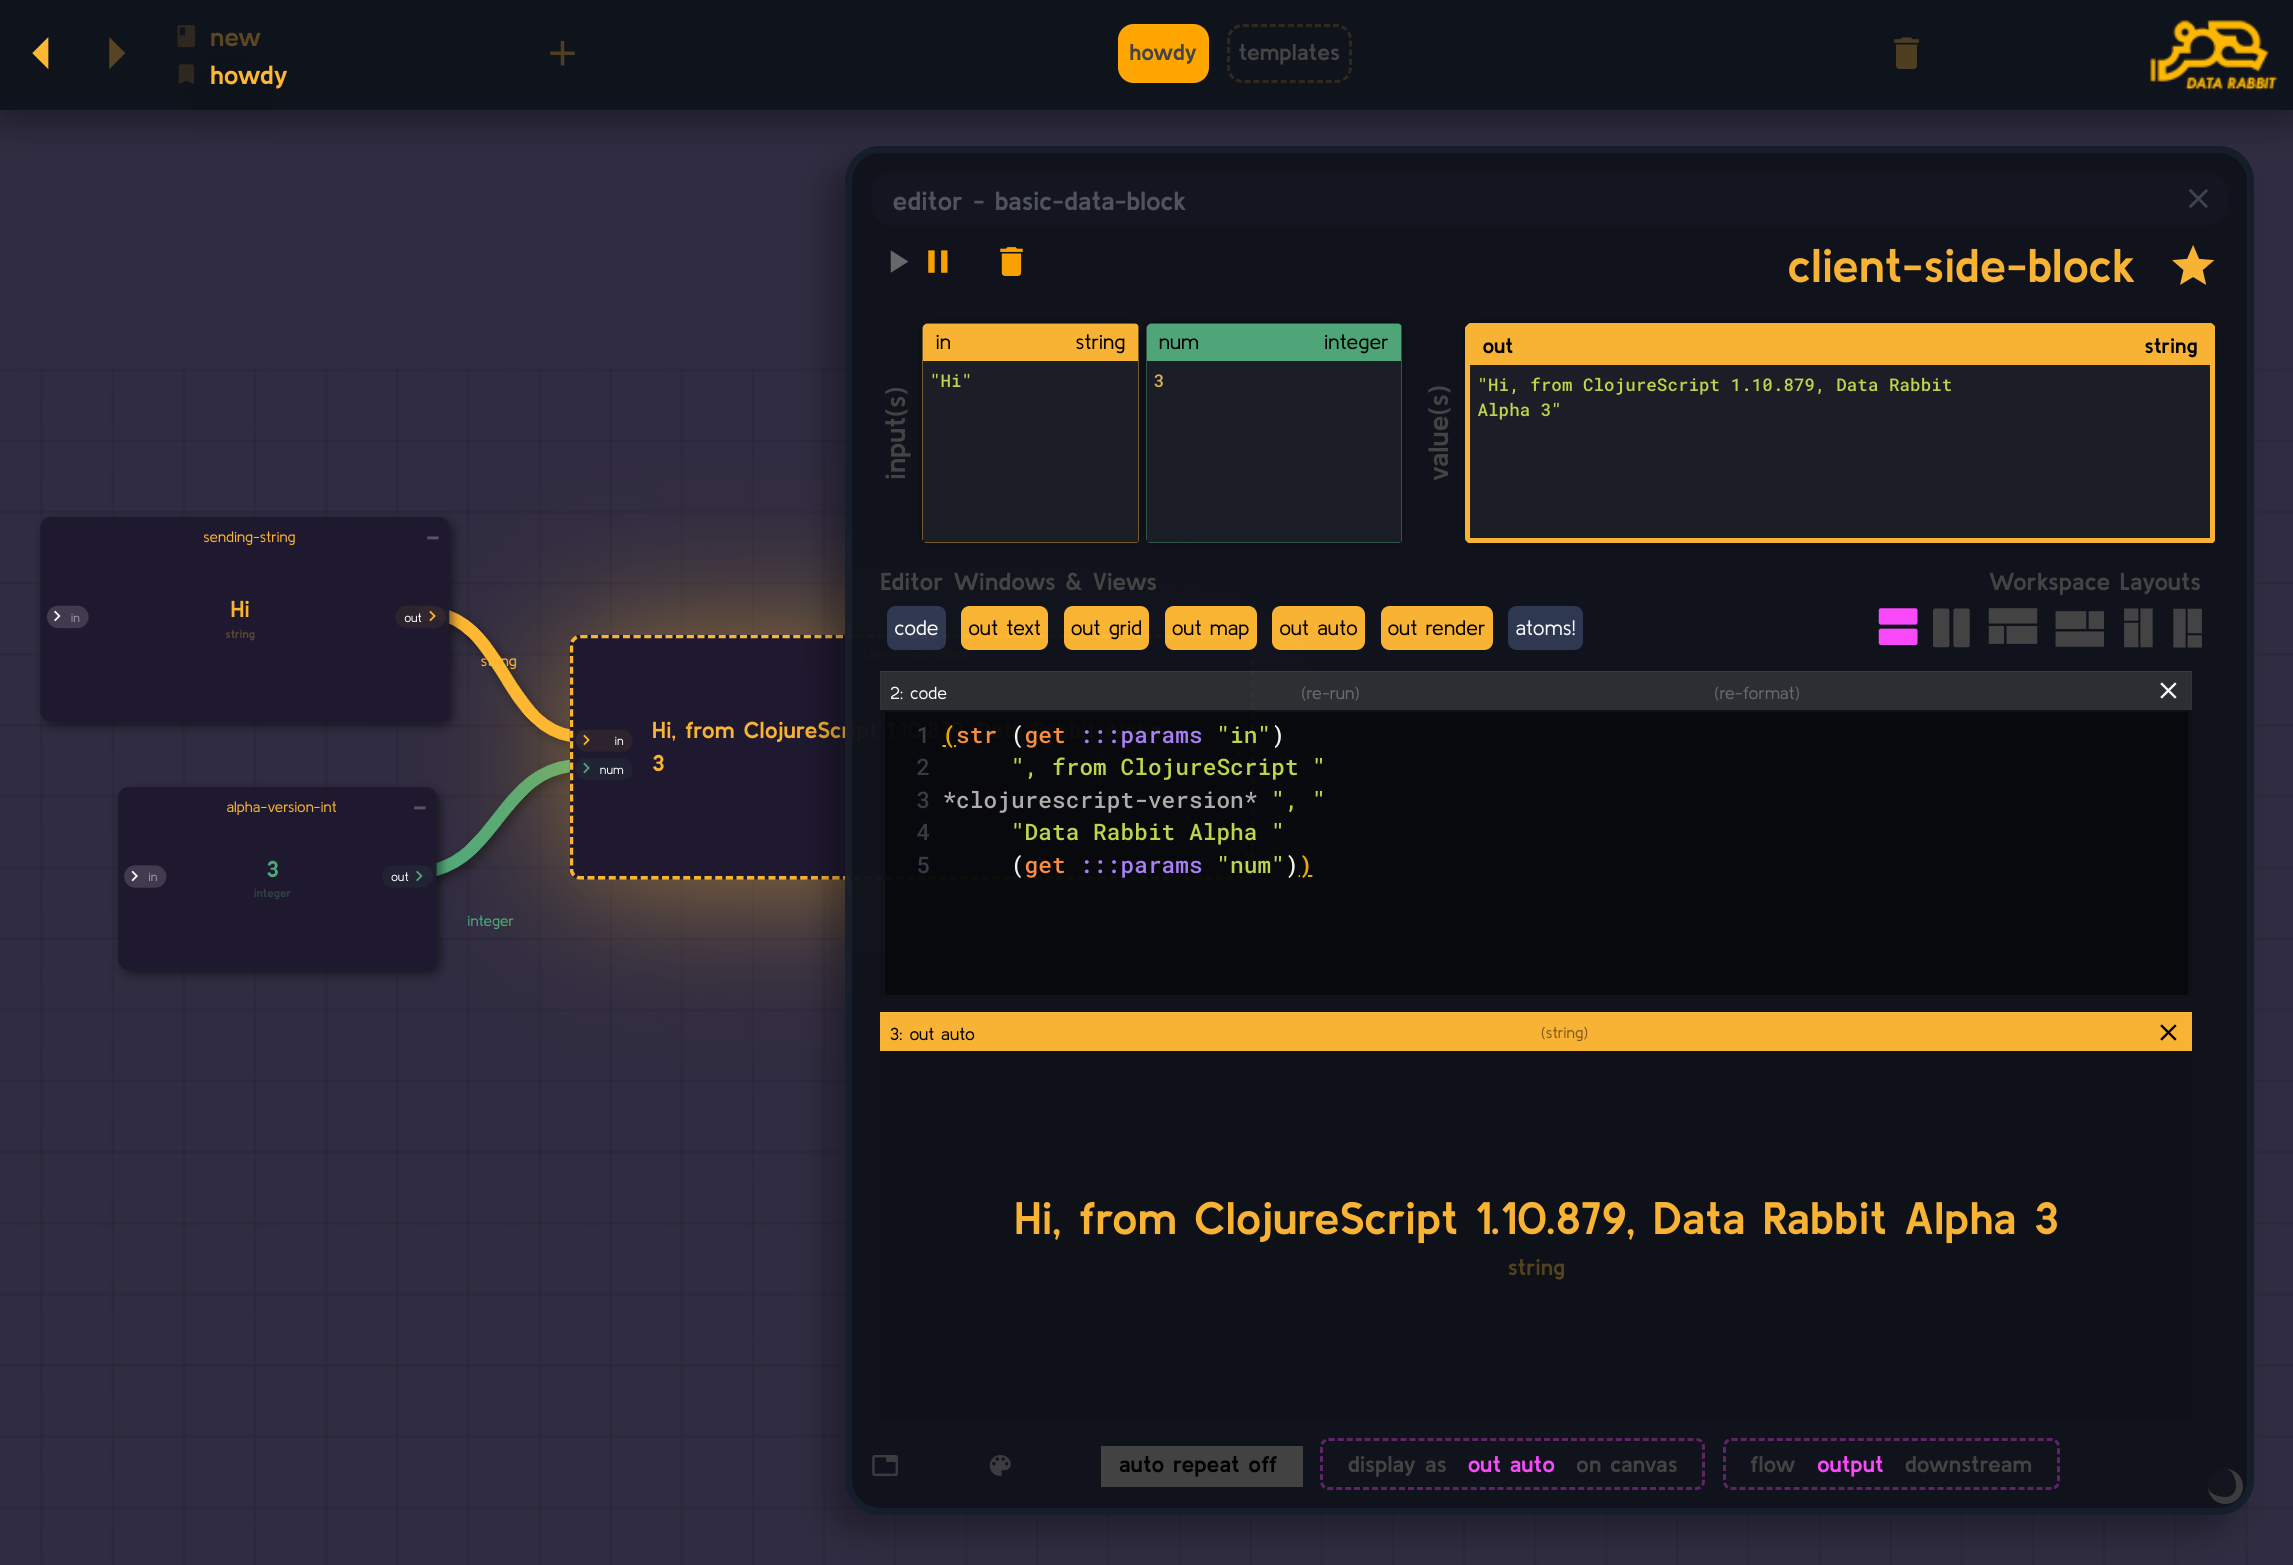
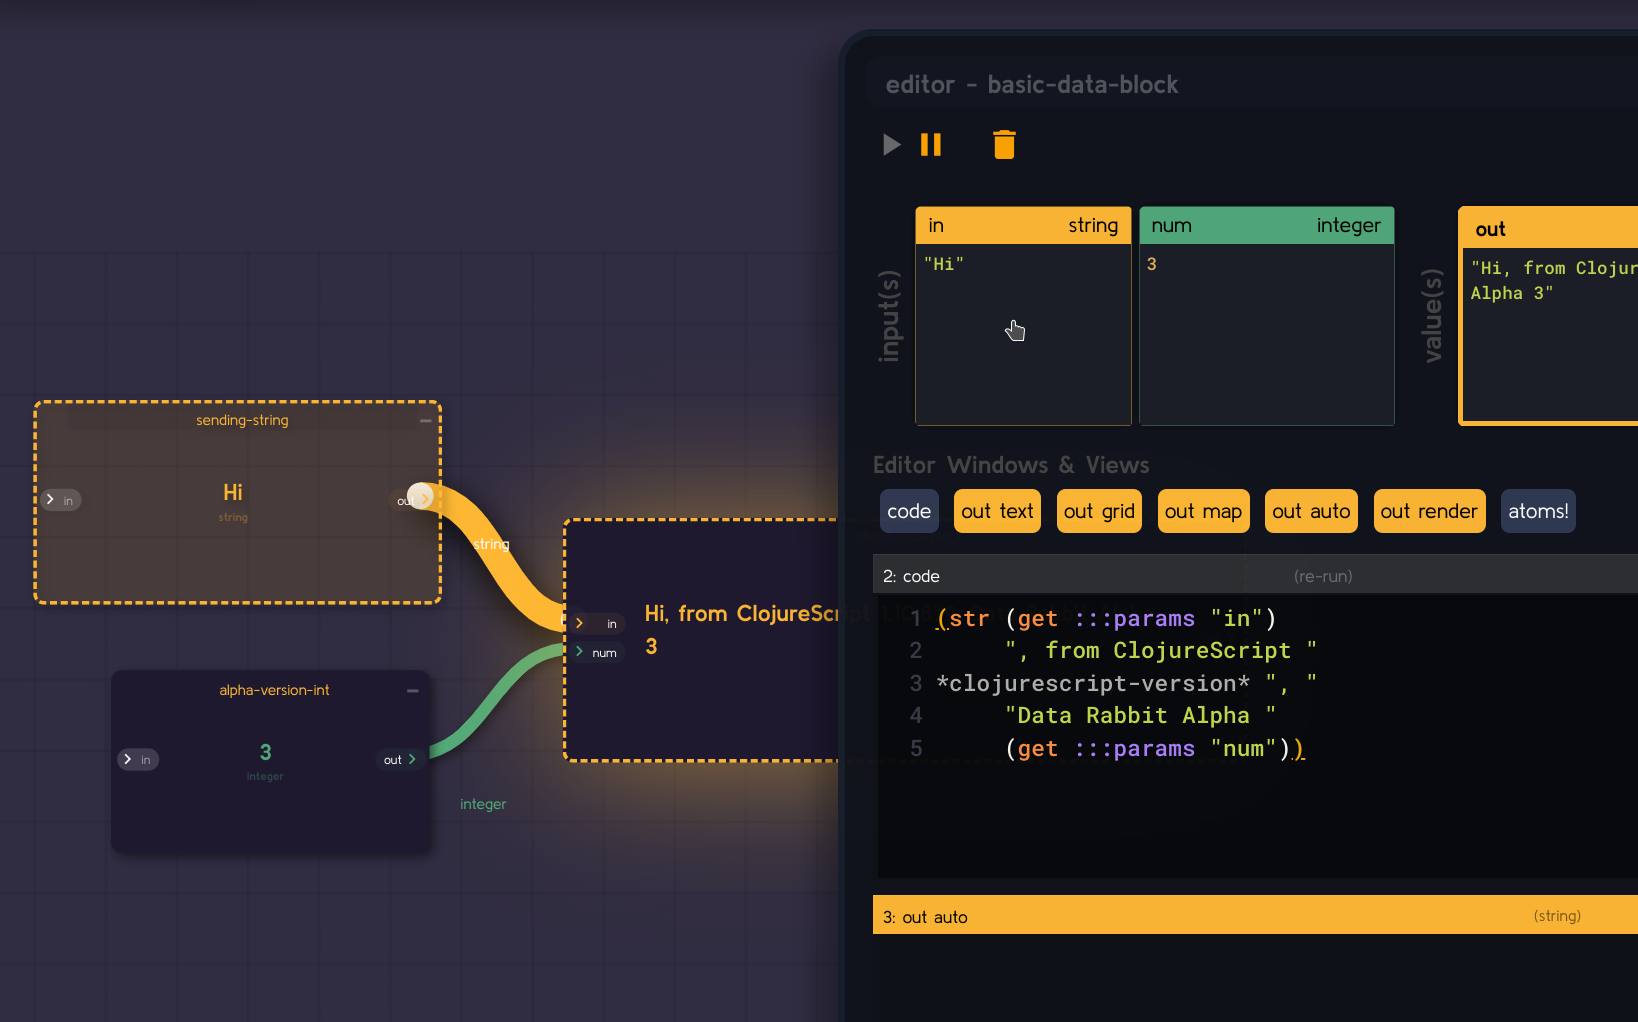
First off we can easily see the code window as well as the output window. Not only that but on top we should be able to recognize the values of our 2 input ports as well as our (unused) output port. In fact, if we hover the mouse over either of the input port values the UI will light up where that value comes from.
To double down on this concept - hit Q / E a few times to cycle through the other 2 blocks. The Editor will remain open and switch to showing their code as they get selected. You will also be able to see the in/out change - each from the perspective of the block in question.
The blocks that send the 3 and "Hi" only care about themselves - they are unconcerned with what happens as long as their job is done. Our right hand block needs to keep track of both of them and make sure that it's code has re-rendered if either of them have changed.
Ok, let's switch back to client-side-block (by either clicking or Q/E over to it).
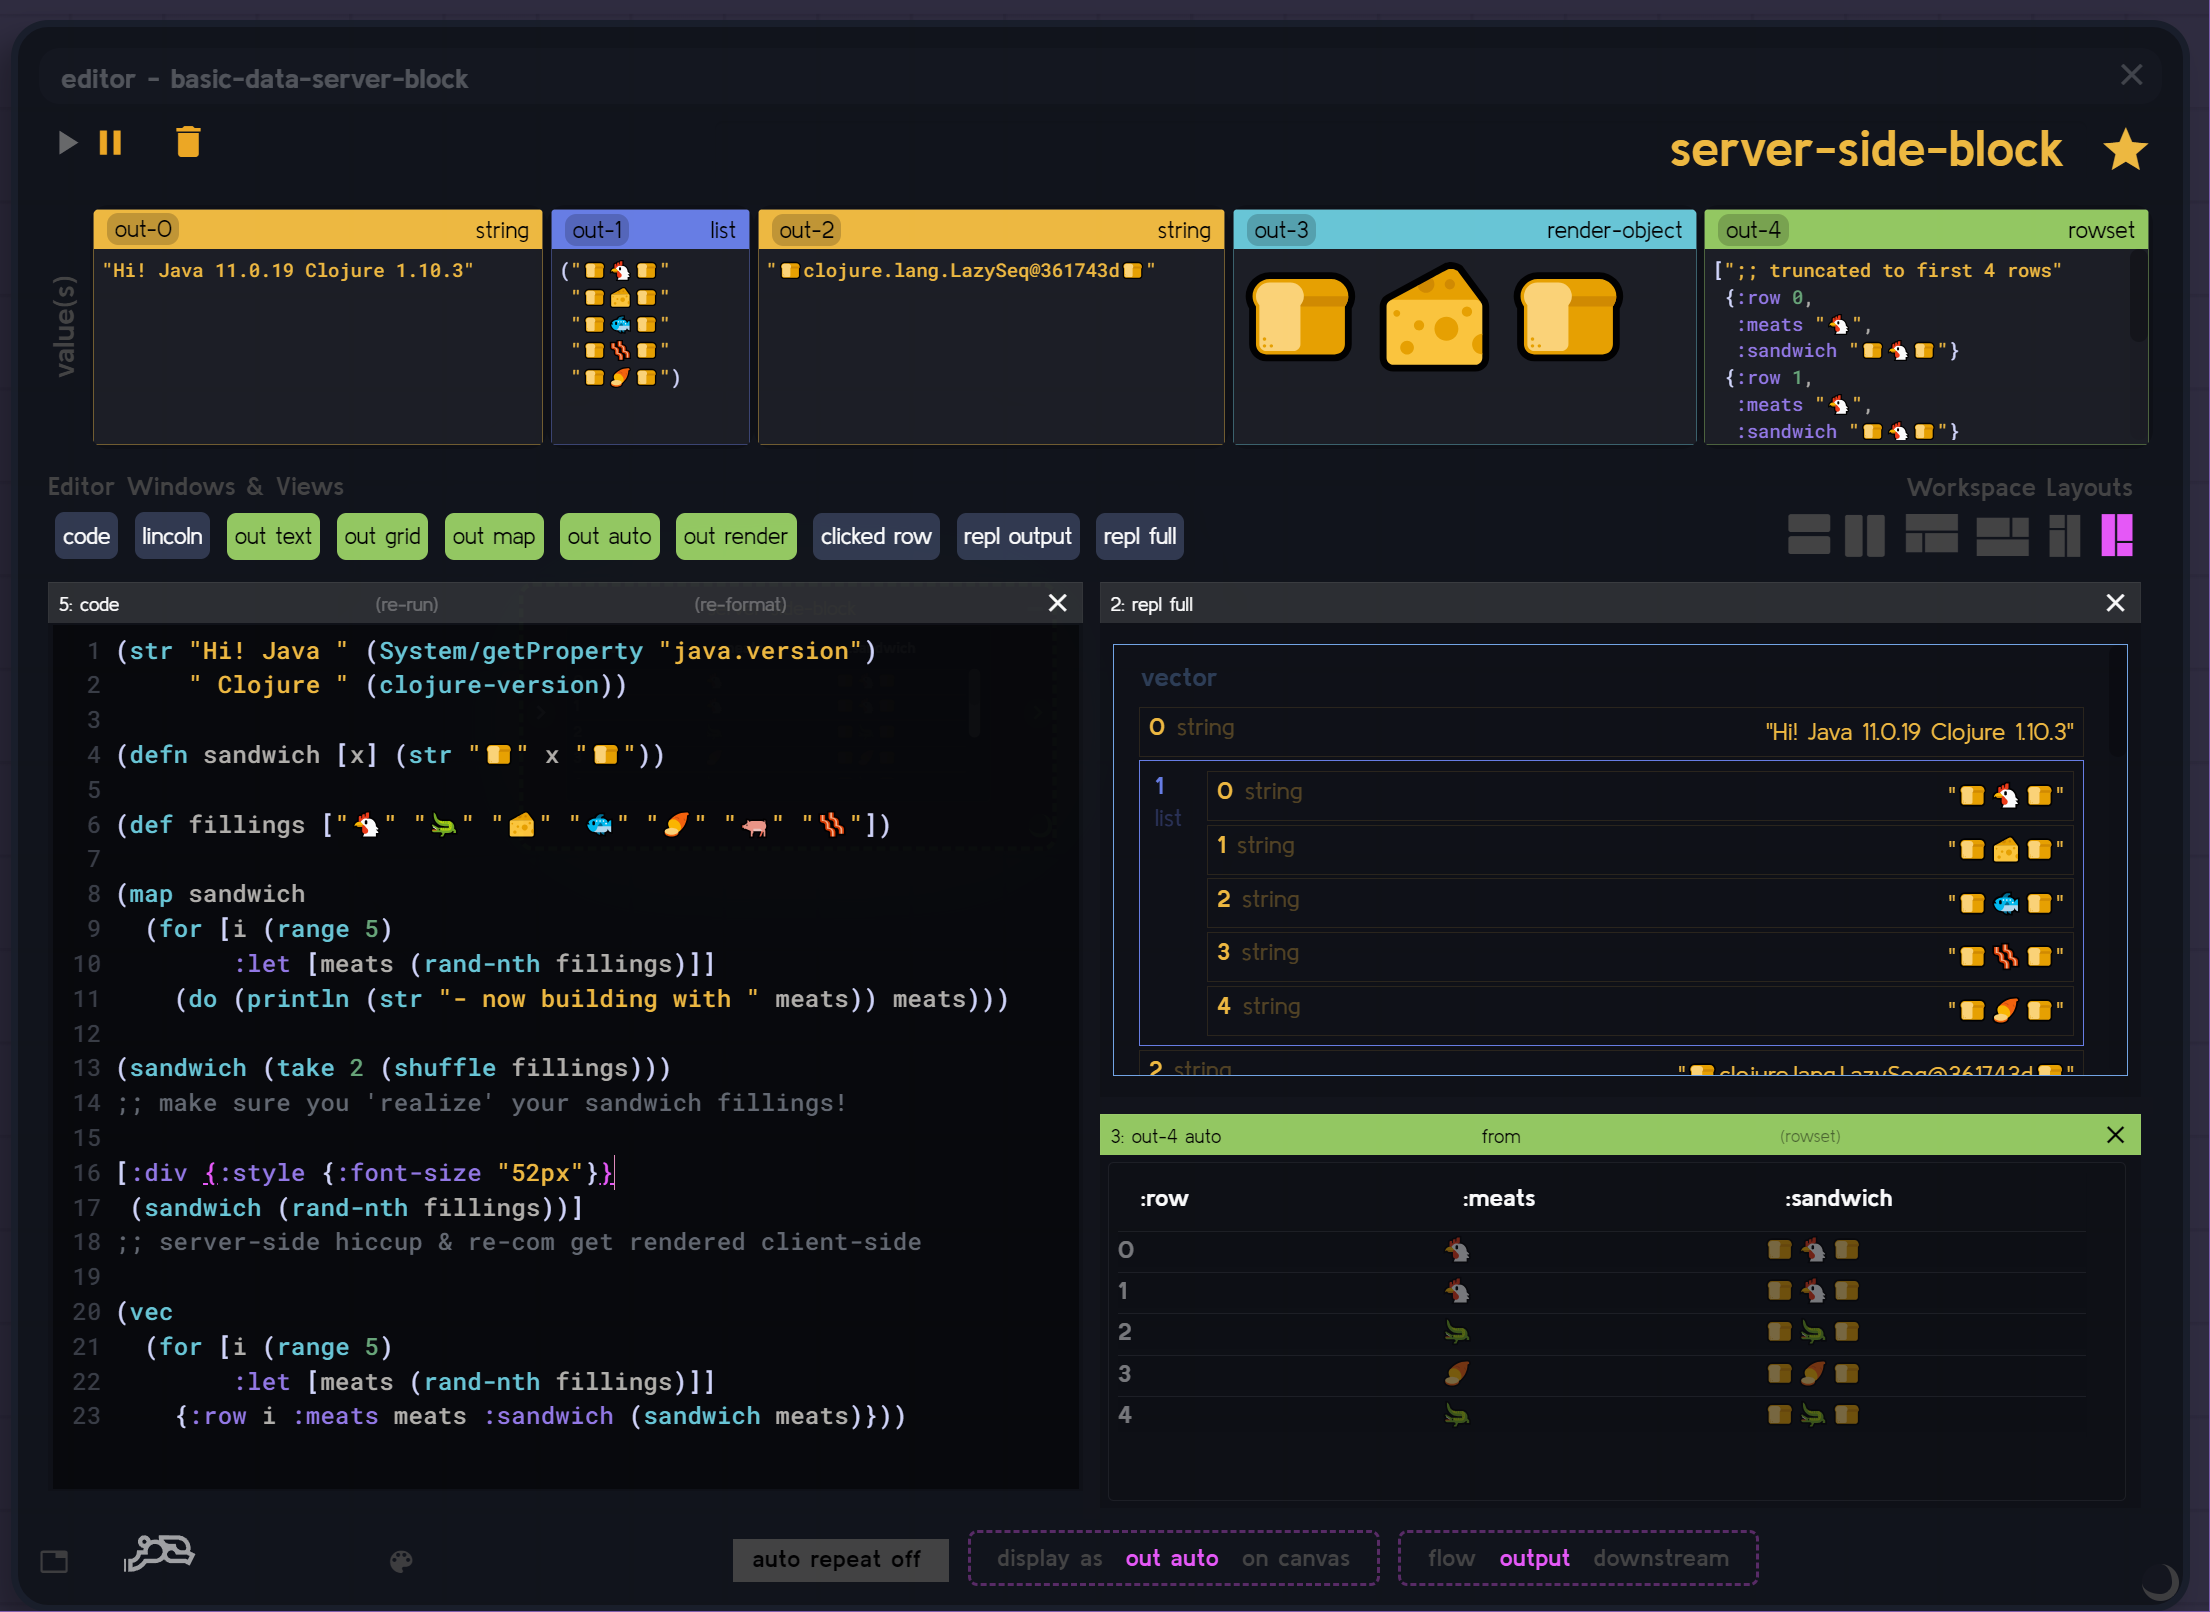
A unique thing about the Rabbit editor is that it can render output in several different ways at the same time. Maybe you want to see the text representation of a map, maybe you want to see it as a tree, maybe your vector is hiccup code and you want to see it rendered as react HTML, or perhaps you have a vector of uniform maps and can be viewed as a grid as in a SQL result set, etc.
In addition to that we have several resizable layouts that these "views" can be inserted into. Let's look at the editor layout bar.
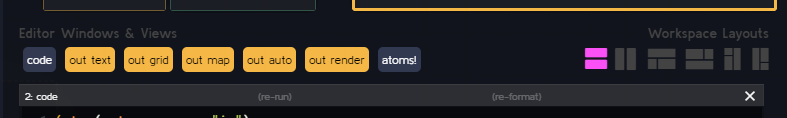
On the left is the available "views" for this block / code / output (different views might be available in special cases).
On the right is the available Editor window layouts you can choose from to put these views in.
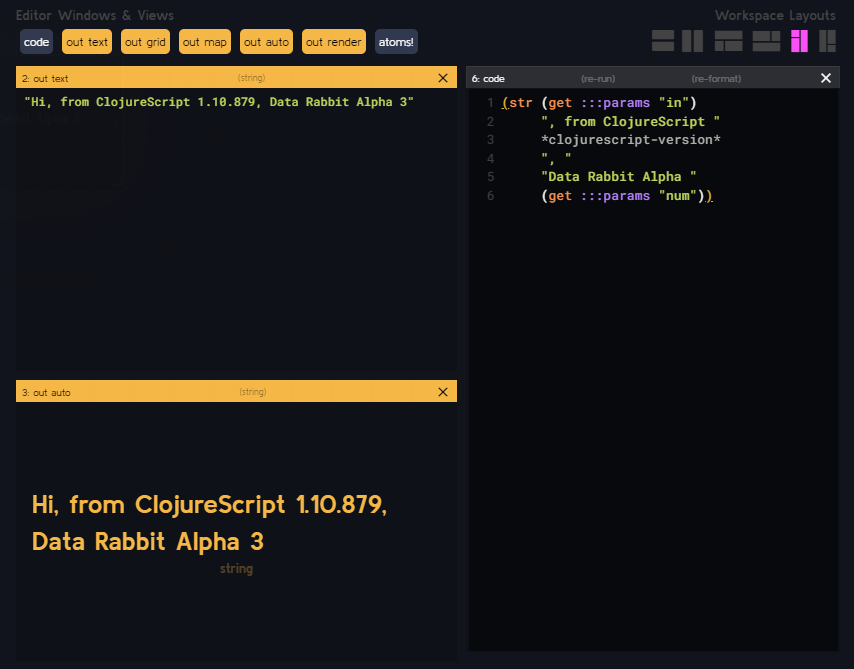
The selected block here is preconfigured to have a horizontal split with the code on top and the "out auto" on the bottom ("auto" just tries to render it in the best way for the type of data it is).
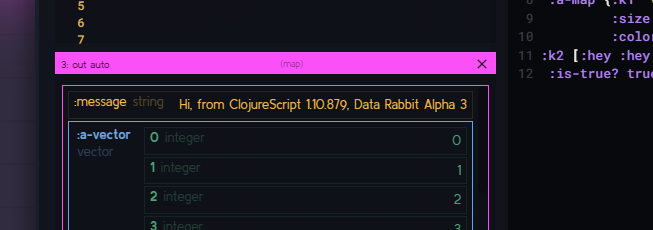
Our output (as we can see in that "output" block on the top right is the simple string "Hi, from ClojureScript 1.10.879, Data Rabbit Alpha 3", however since the viewer is set to "out auto" it renders a large font version with a data type decoration that says "string".
Note: You might also notice that all strings - no matter if its a data flow line, block output, or view header will be this yellow color (integers are green, maps are pink, vectors are blue, and so on).
Data types in Rabbit all have colors associated with them, and this is consistent throughout the interface. This can be very helpful when looking at a zoomed out flow map and being able to tell what kind of data is going in/out of any given block (even though Clojure is a dynamically typed language).
Let's change the editor views for this block - go ahead and select the 3 panel 2:1 side-by-side option on the right.
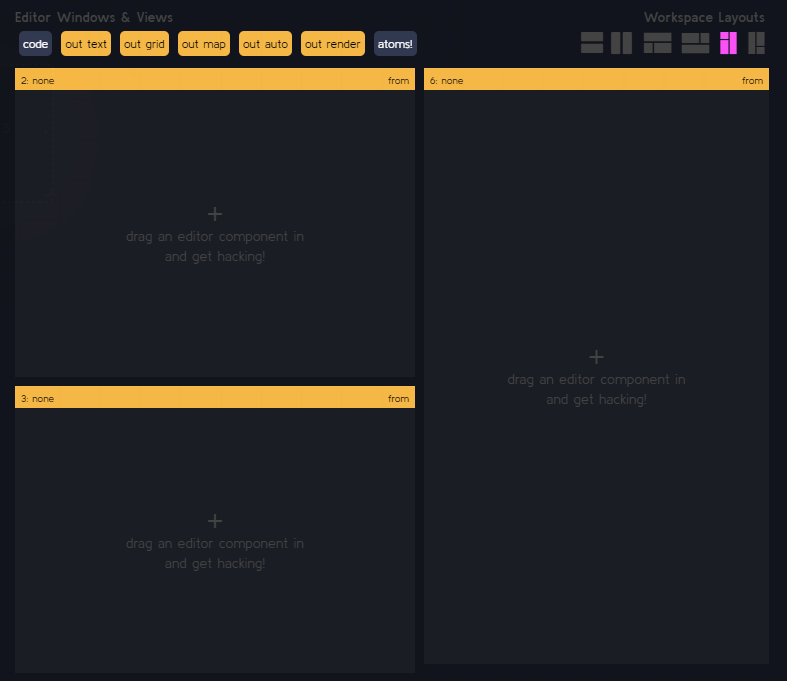
We now have 3 blank editor viewer windows to use (and can drag the dividers to make portions larger or smaller).
First of all we want to have the source code to edit. Drag the "code" pill on the upper left to the long window on the right and drop it.
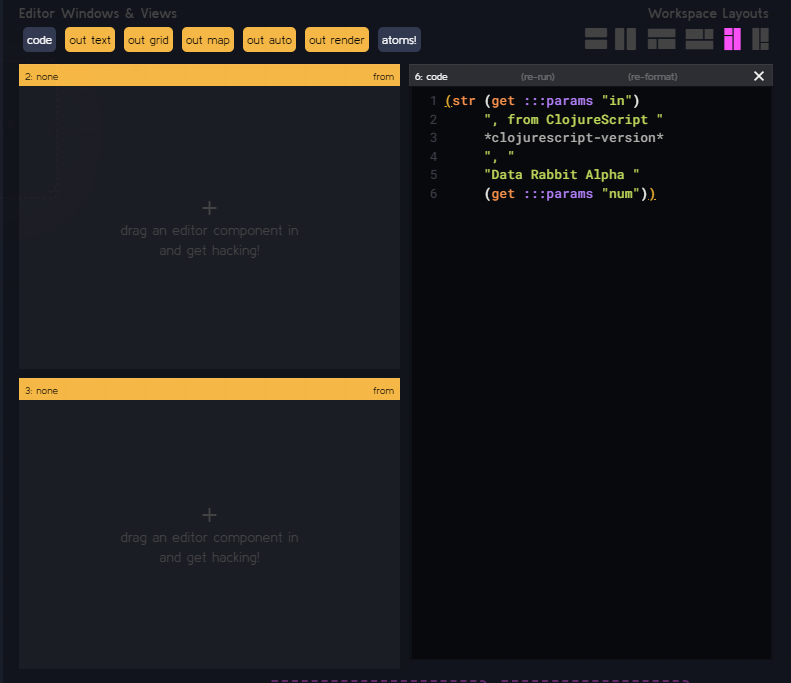
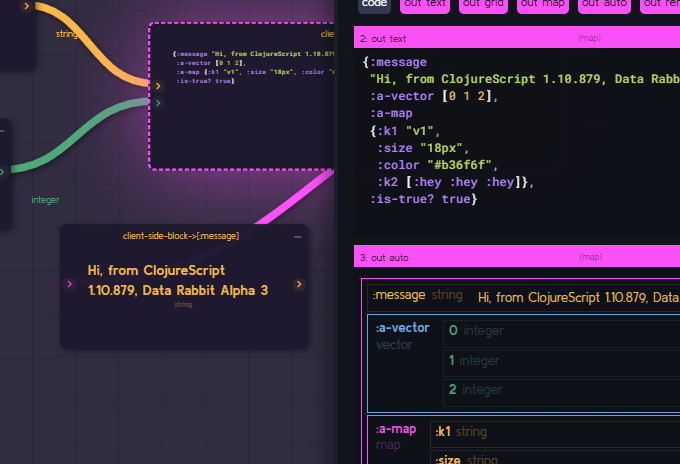
Nice. How about we use the other 2 views to view the output in 2 different ways. Drag "out text" to the top left, and "out auto" to the bottom left.
As we can see the "out text" just gives us the raw text from the block evaluation, while the "auto" version is a bit fancier - this gives us a lot of flexibility in being able to "see" what is going on with our code and it's edges.
For example, if I were to change this output string to a map with various keys - the way the output renders would change dramatically to match the data.
Copy and paste this new code into the code window and then click out anywhere else on the page for it to execute.
{:message (str (get :::params "in")
     ", from ClojureScript "
     *clojurescript-version*
     ", "
     "Data Rabbit Alpha "
     (get :::params "num"))
 :a-vector (vec (range 3))
 :a-map {:k1 "v1"
:k2 [:hey :hey :hey]}
 :is-true? true}
Boom.
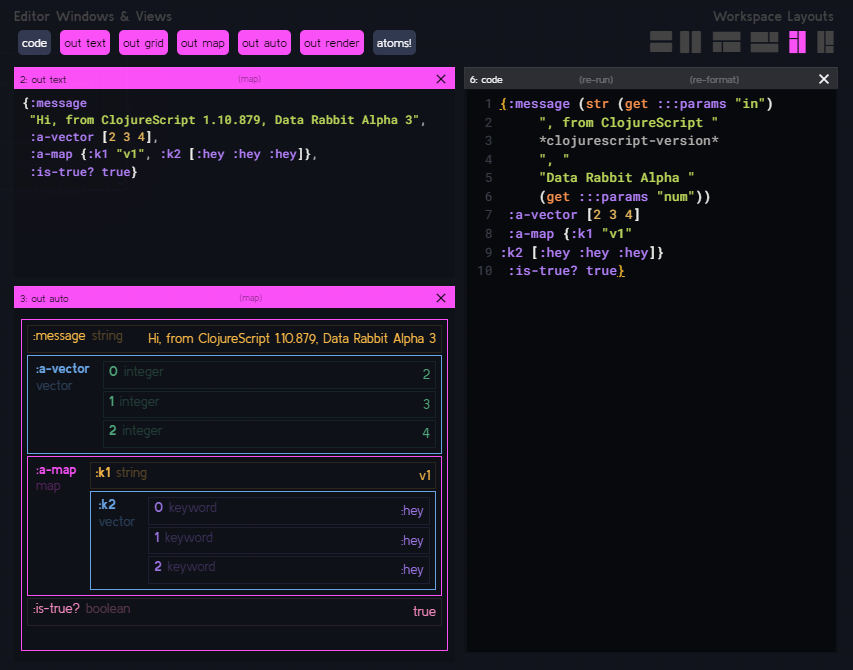
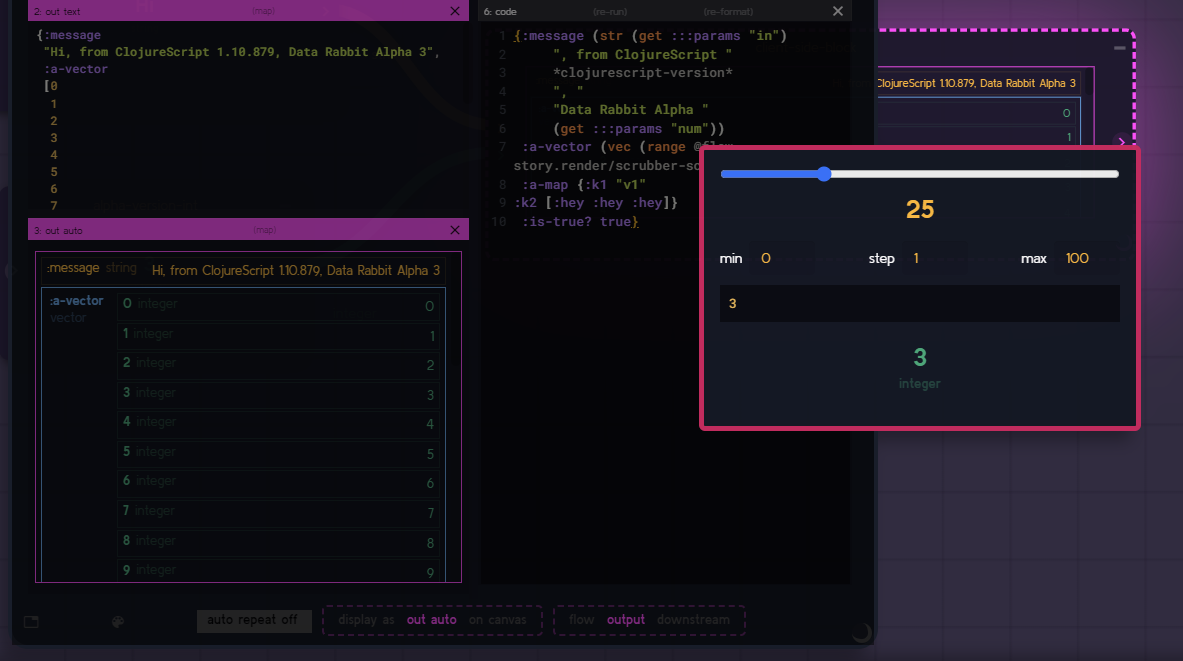
Our "out text" panel, predictably, is showing us the raw output - while the "out auto" window has changed to a nested map-view so we can see the various values and their associated data types within.
The Editor has some more interesting tricks up it's sleeve as well. If you notice there is a nested range fn call in there to generate a vector. Somewhat similar to tools like Lighttable, Rabbit can evaluate code snippets "out of context" and show their output in a pop up window. This can be handy for debugging smaller portions of your code w/o leaving the block.
Let's use our cursor and highlight that little vec + range call and the (while still highlighted) right-click it...
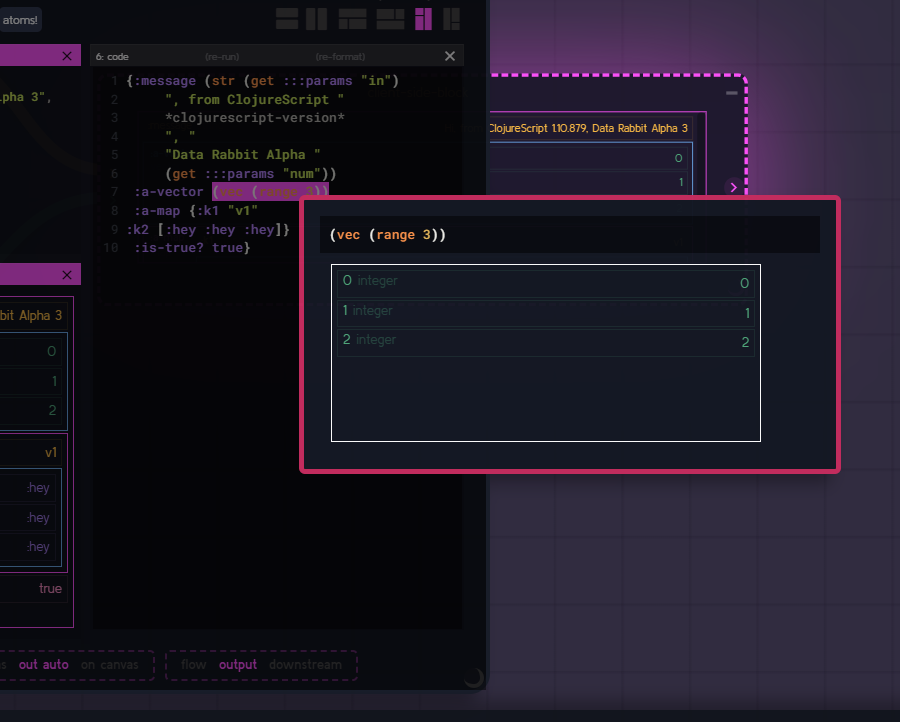
We can see that call by itself visualized as the 3 element vector we see here. Maybe we want to only look at the range call inside it...
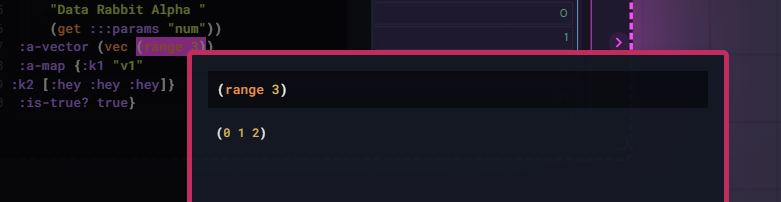
Here it is as it's natural list output instead.
Now let's "evaluate" that "3" integer...
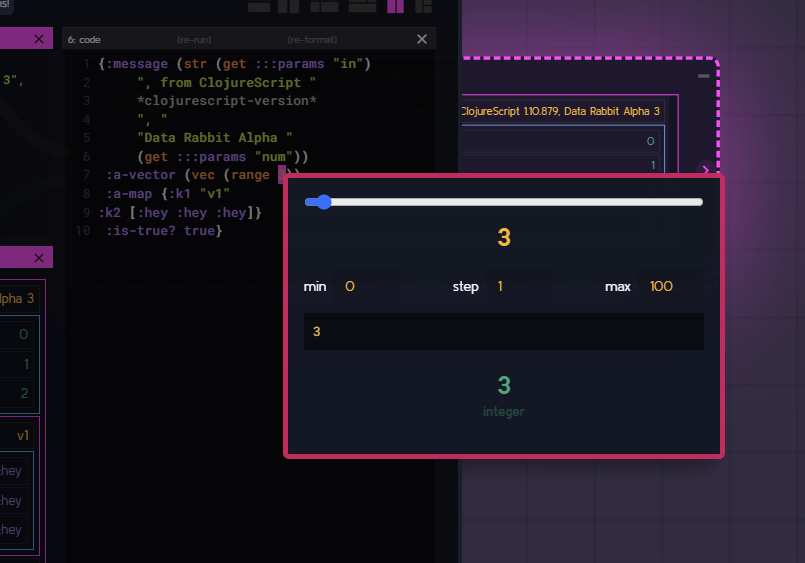
Oh, look at that - we can see the "evaluation" on the bottom with is an integer of 3, naturally - but since the UI has recognized that this is a single value that can be changed - it has inserted a "scrubber" UI for this value.
Feel free to use the slider to change the value up and down and notice the output of the block in the adjacent panels change as you do so.
This is great for getting the "feel" of changes in code for small things that support it: integers, floats. pixel sizes, hex colors, booleans, etc.
Note: Direct manipulation interfaces have been around for a long time, but in the modern UI community it was re-popularized by Bret Victor.
I could opine about this all day long, but instead please check out some of his amazing demos & talks on the subject. Well worth the time and a big source of inspiration for me personally.
Also: It's worth noting that this kind of manipulation gets especially interesting when you factor in the flow map. If you selected (or Q/E cycled) over to the "3" block on the left and did the same with it, you'd see the string change in the downstream block also...
Blocks re-render in a cascade when their inputs change.
Backing up again: If we were to look at the canvas representation of our block (by moving the editor over, or toggling it on/off with Shift-D) we'd see that it's outline color (pink for map) and render output is now equal with this "out auto" representation by default...
But let's say we didn't want this type of render to be on the canvas - let's say we wanted the text instead.
Take a look at the very bottom of the editor panel - you'll find a small viewer target for this use.

If we dragged another "out text" pill and dropped it into the "display as" box here - the canvas render would change appropriately.
Ok, now that we've become more acclimated with the Editor - let's talk about flow lines and parameter passing.
You might have seen these map get fn calls in our block code that look like this.
(get :::params "in")All of the inputs to each block (as noted by the flow lines) are essentially a special map called :::params with the port name as it's key. This makes picking up input values pretty natural and Clojure-y.
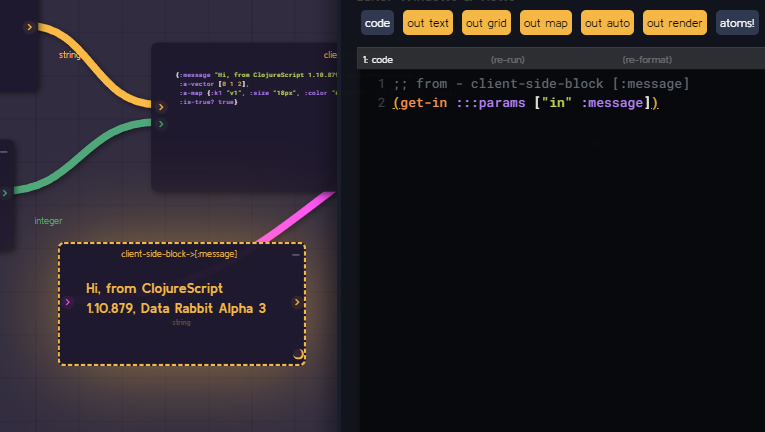
Let's give it a try - go back to the canvas an look at our client-side-block again. Do you see the unused "out" arrow and node on the right hand side? Click and drag it out to the right - this will create a new block that pulls the output in by default. Give it a try.
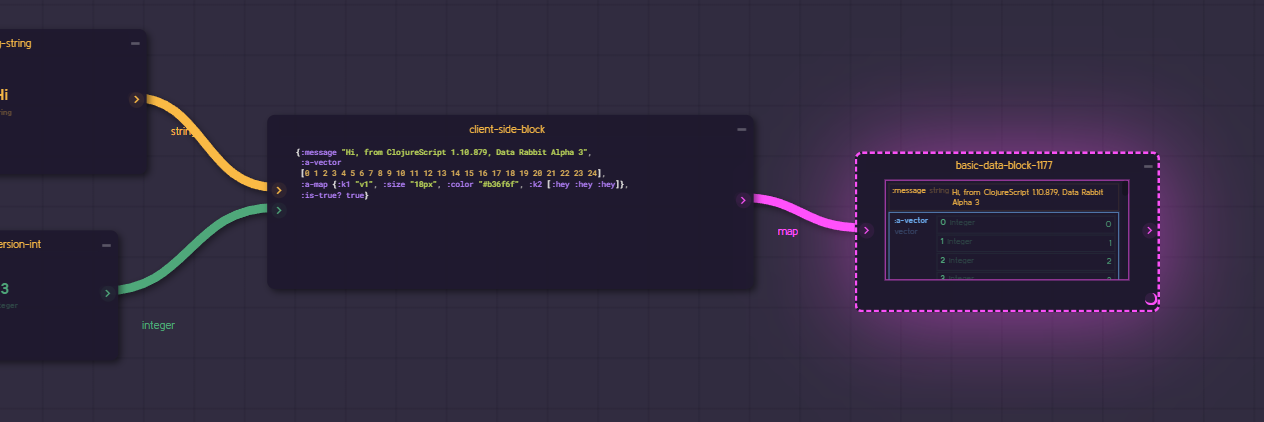
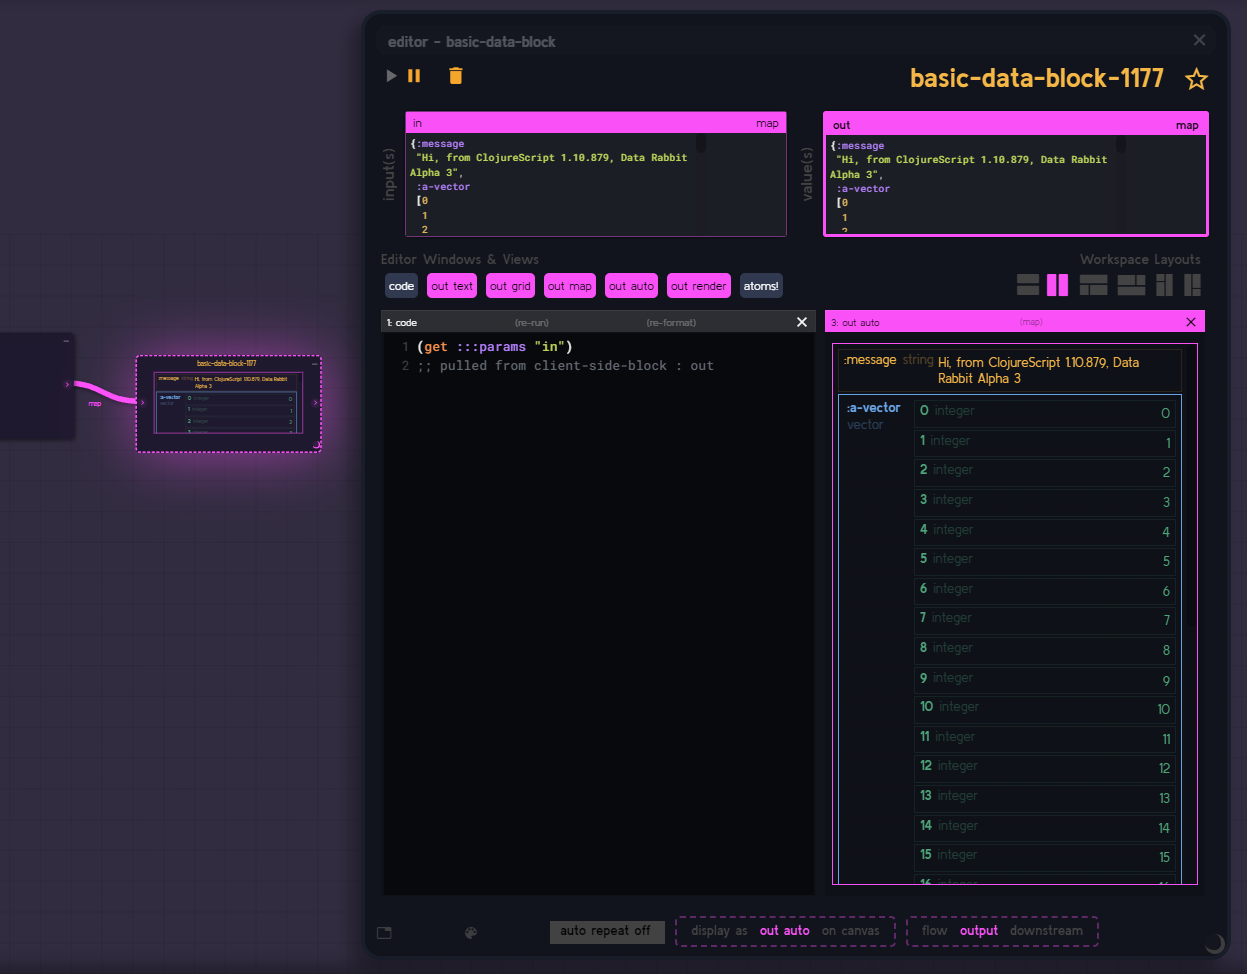
If we select this block and pull up the editor we can see that it's code is literally just "hey give me the input" with (get :::params "in"). The line is pink since we are passing a map, and the outline of the new block is pink as well, since it is now a map also (since it's just pulling the other block's map).
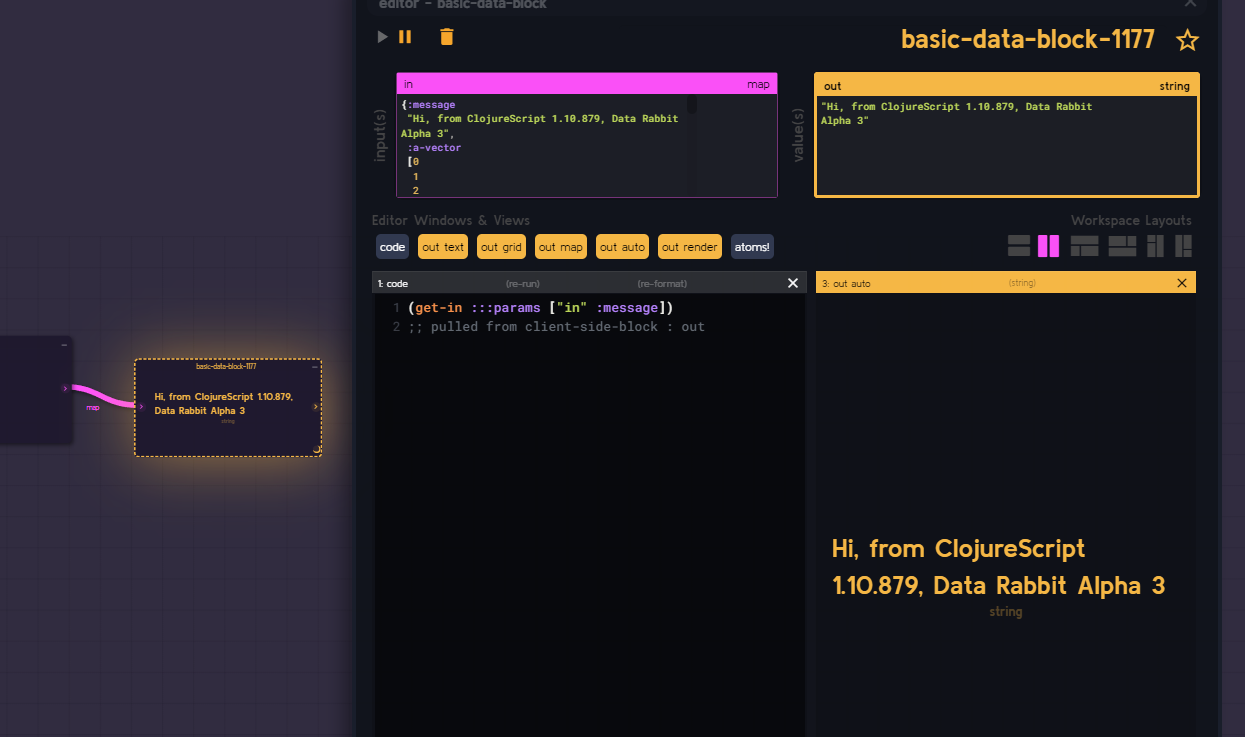
Since our incoming value is also a map, we can change this into a get-in fn call to pull the original string out - let's change this blocks code to:
(get-in :::params ["in" :message])Now we're back to where we started, output wise.
But since maps are so ubiquitous in Clojure(script) there is an easier way to do this same thing. Let's delete this block and do it again. Delete the new dragged block by using the trash can in the editor upper left when selected - or hitting shift-delete when it is selected.
Note: Most actions can be undone (including deletes) by hitting Ctrl-Z or by using the undo/redo (forward/back) arrows on the top panel (located in the upper left).
Back to our client-side-block block. Select it again. Locate the :message key in the "out auto" window of the editor..
Grab the :message key and literally pull it out and drop it on the canvas.
In doing so, a new block has been created and it already contains the needed get-in fn call to retrieve the string we want.
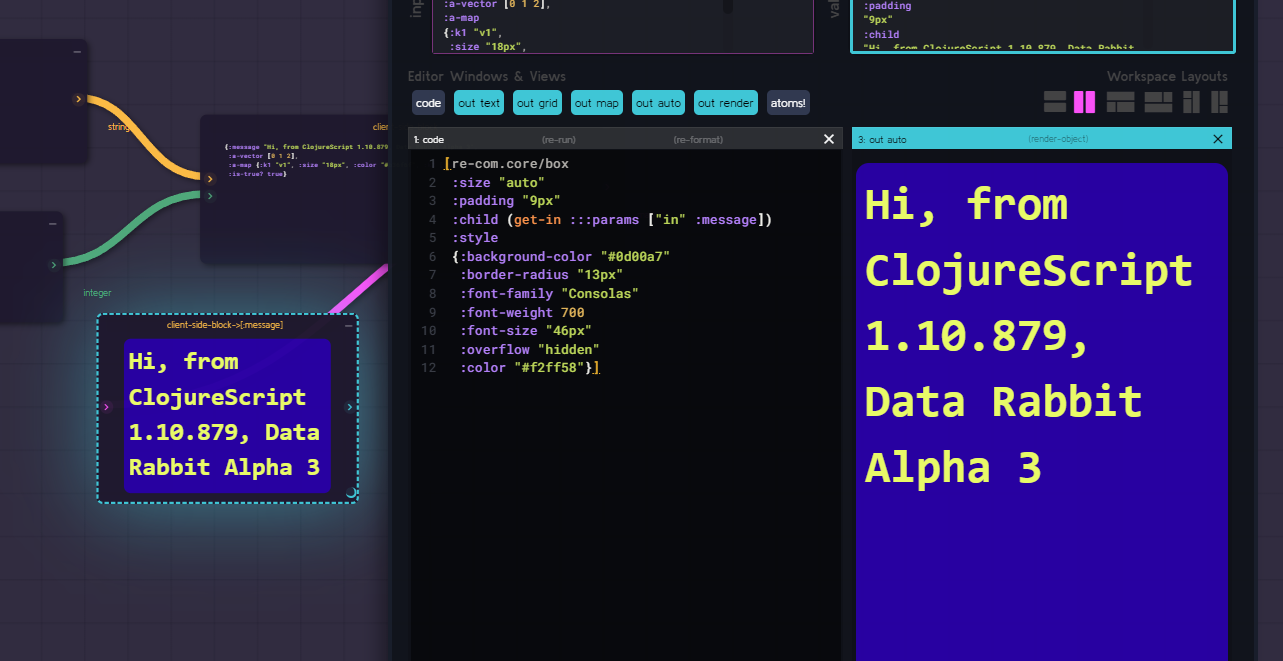
Ok, let's wrap up with some simple re-com rendering and css. Paste this code into our newly generated block.
[re-com.core/box
 :size "auto"
 :padding "9px"
 :child (get-in :::params ["in" :message])
 :style
 {:background-color "#0d00a7"
  :border-radius "13px"
  :font-family "Consolas"
  :font-weight 700
  :font-size "46px"
  :overflow "hidden"
  :color "#f2ff58"}]
You'll notice that our "out auto" is now rendering the output instead of showing it as a map or as text.
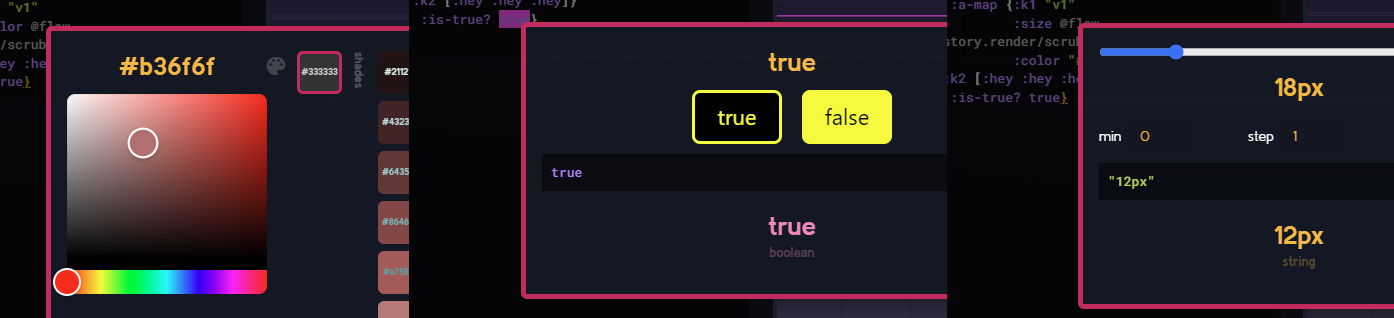
Feel free to highlight any of the pixel values or hex colors to scrub them around and see the changes in the output.
CSS map keys and values are very common things to scrub with, so there is an extra bit of functionality I didn't mention earlier. Take the font name, "Consolas". If you were to highlight it and eval it, it would just show the string "Consolas" becuse the editor doesn't know what it is supposed to be, and unlike integers or pixel values it can't infer what it is supposed to be.
However, if we highlight both the key name AND the value, we can do some scrubbing. Highlight that entire row and right-click.
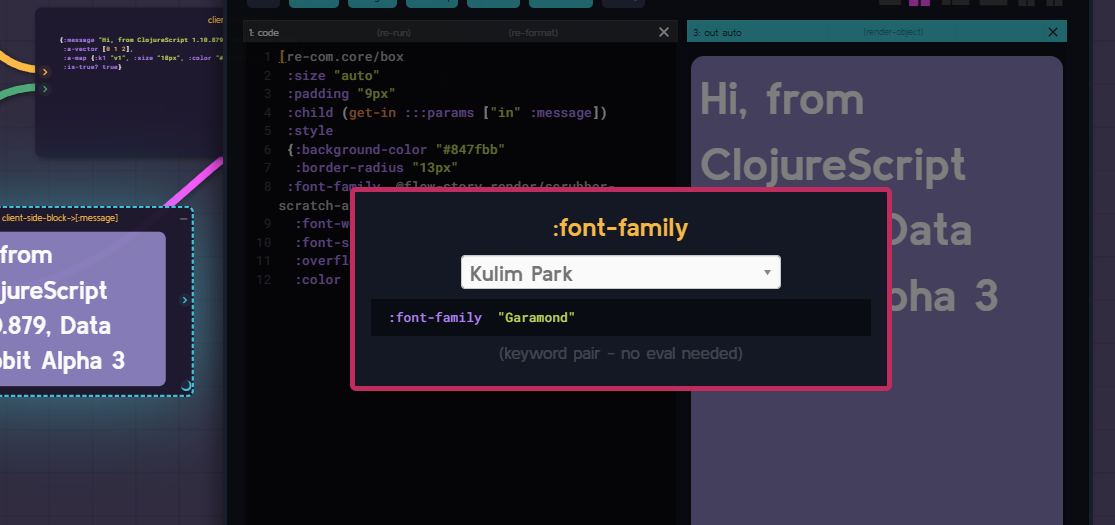
:font-family
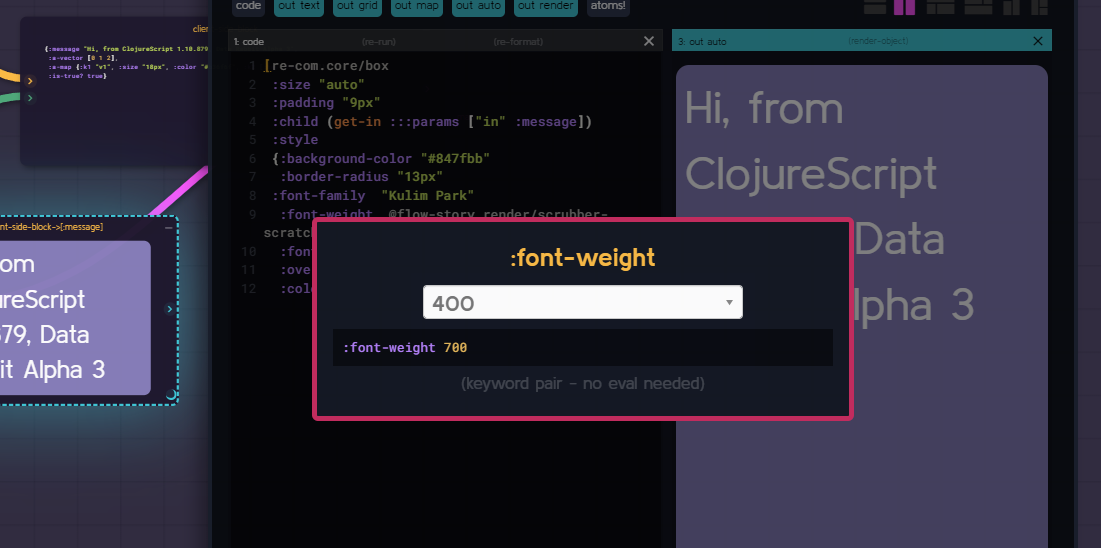
:font-weight etc.
Better yet - have a custom keyword + value combo you want a custom dropdown or button picker from? It's all user configurable in the flow settings (hit the tilde key and navigate to "k/v pairs" tab) - but we will cover that another time.
We didn't do anything fancy here, but I hope this gives you some ideas about what is possible - and I hope the interface is less daunting after this.
If you want to save your progress on this flow for later - you can use the "download flowset" to save the file locally, and "load .rabbit file" later to bring it back.
Next post we will get into using the Visual Composer, Reagent Atoms, SQL Helpers, Viz, Data Re-aggregations and more!
Also, if you haven't seen my ReClojure 2022 talk on Rabbit, feel free to check out the video on their YouTube page - or (a slightly higher-res version) posted on my Twitter below.
My Data Rabbit Presentation from reClojure 2022,
— Ryan Robitaille (@ryrobes) February 17, 2023
"A System Built for Seeing" (twitter version, ~25min). pic.twitter.com/MtUTdqON1o