If you've seen the talks, my postings on X, read any of my older writings - you've likely heard about some of the fancy things that Data Rabbit can do. The problem is, for some people - it might not be super useful for day to day "normal" work.
Data Rabbit can be a great learning tool and help to ease people into Clojure as an all-in-one interface - where they can maybe then "graduate" to some other tool of their choice when they start to feel comfortable. Hey, that's a win in my book.
But it often gets overlooked as a really nice nREPL client (even by me).
Why use it instead of a shell REPL?
Lots of reasons, but some of the main ones relevant to CLJ REPL work are:
- Easy to edit / re-run commands
- Data output AND console output views available
- Easy bridge in and out of CLJS blocks for visualization
- multiple forms = multiple outputs
- multiple blocks = multiple namespaces (or just sep code snippets)
- in-line snippet eval (a la LightTable)
- visualization of data structures
- save-able to share or come back to later
- can connect to any external nREPL running (or multiple in the same canvas)
Let's get started
Here is my no bullshit step-by-step guide to using Data Rabbit as a REPL client for day to day productivity (which in my case is usually writing snippets that get cut-and-pasted back into a larger project in my code editor).
- Download the archive, unpack it, go into it's folder, and boot rabbit up
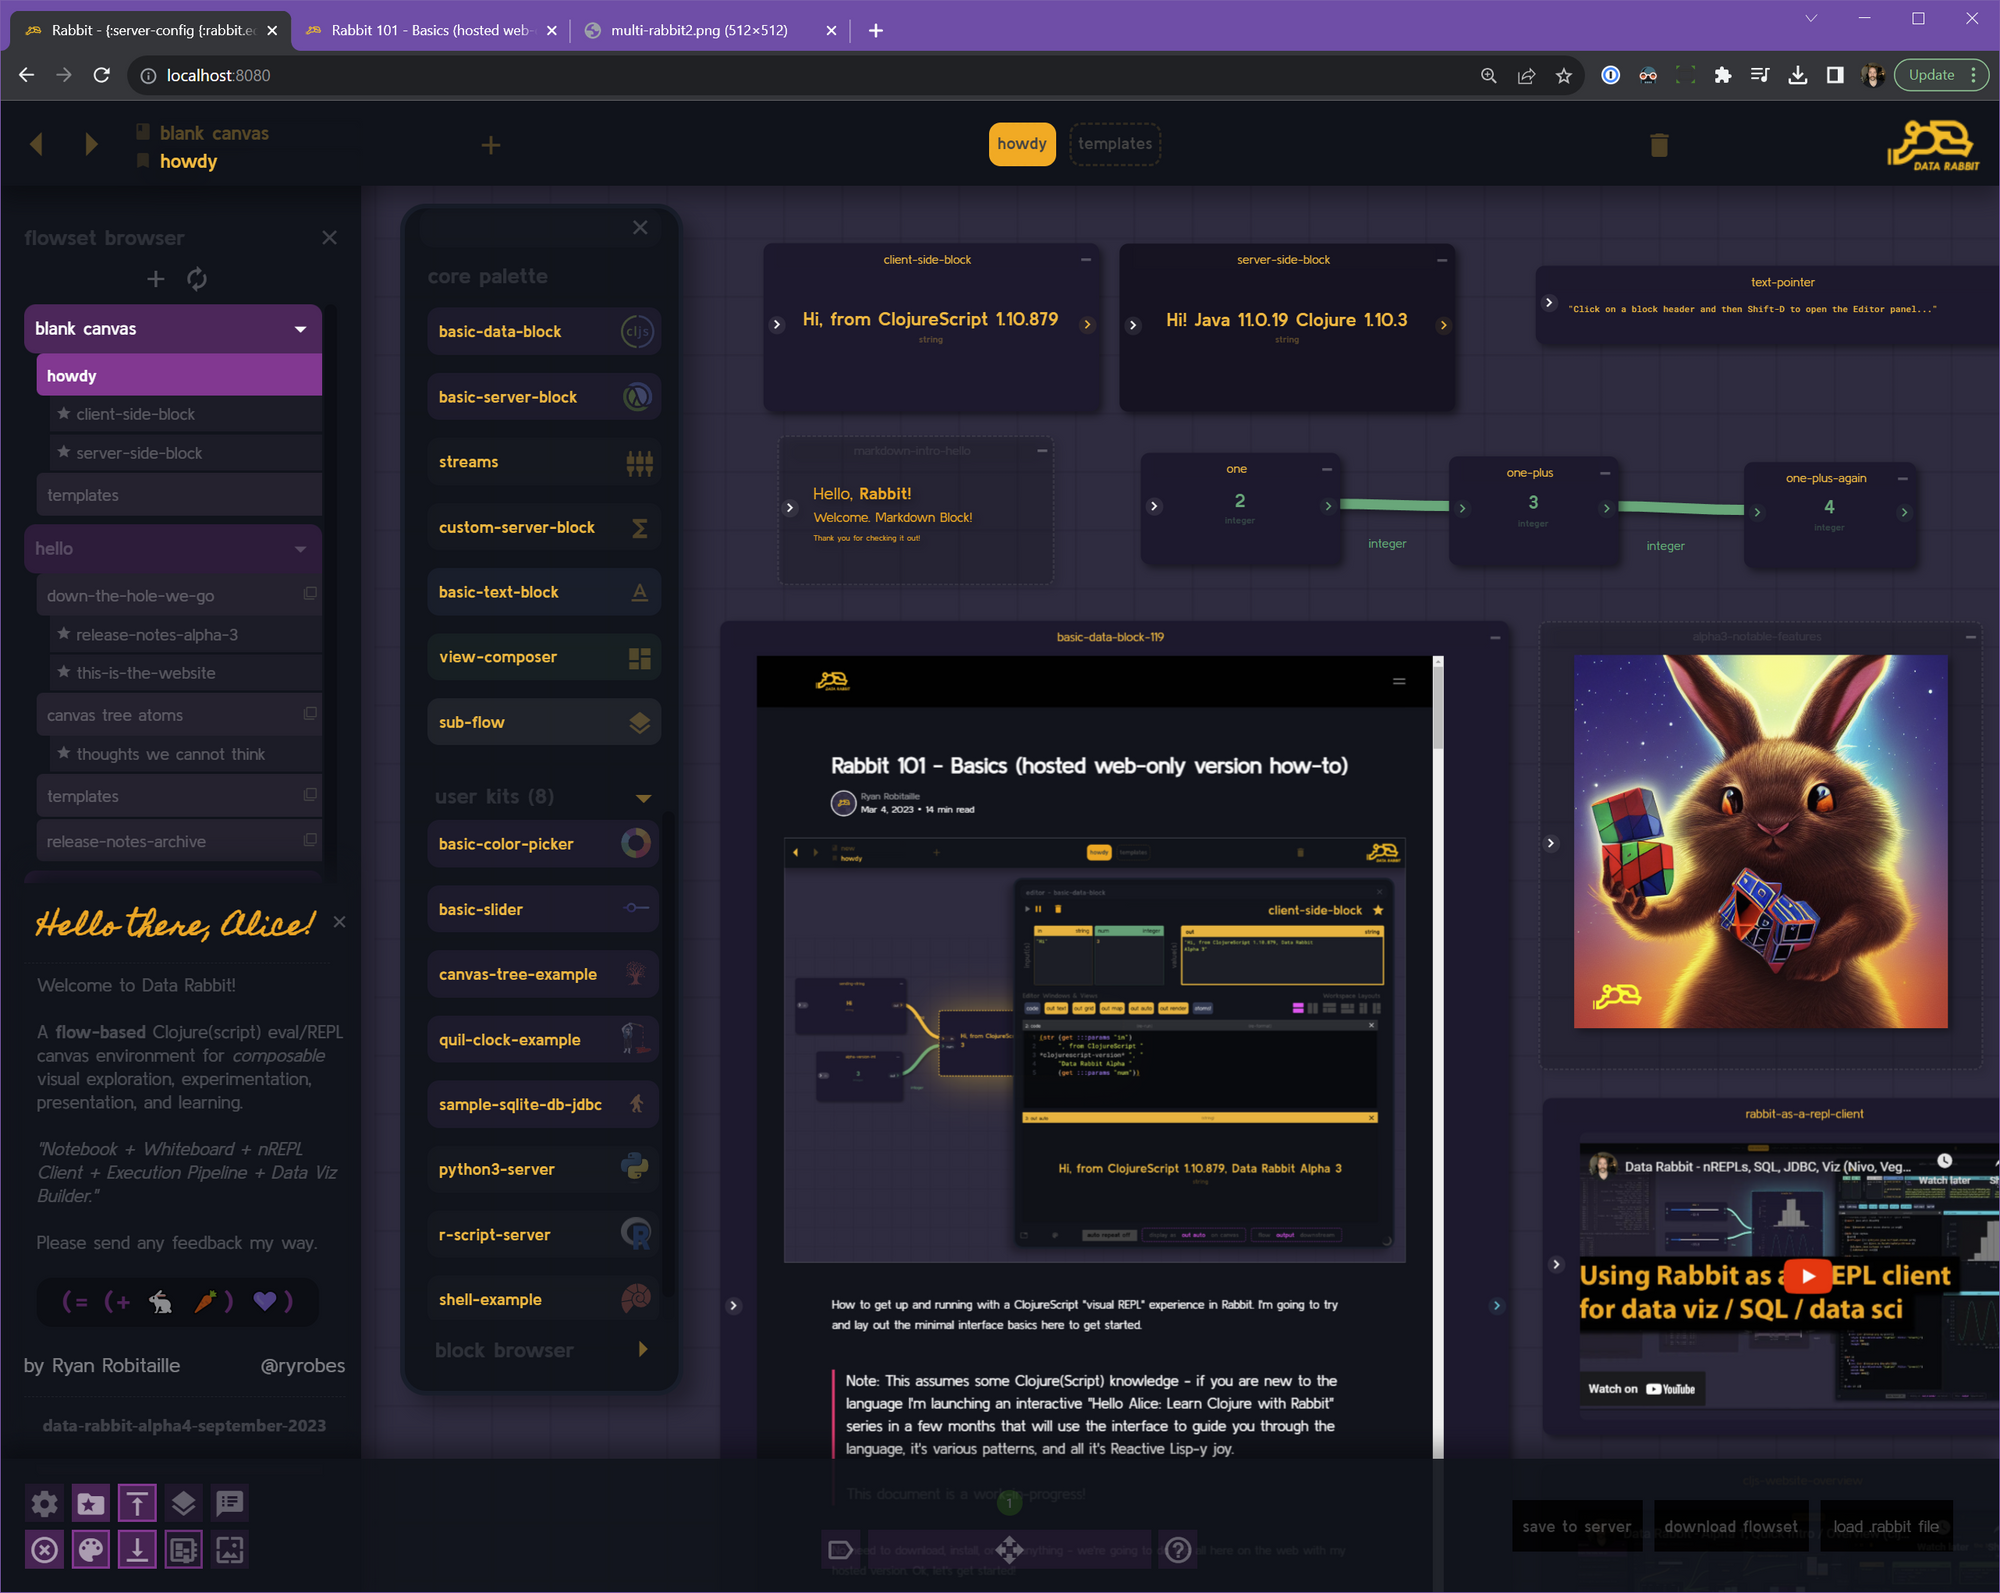
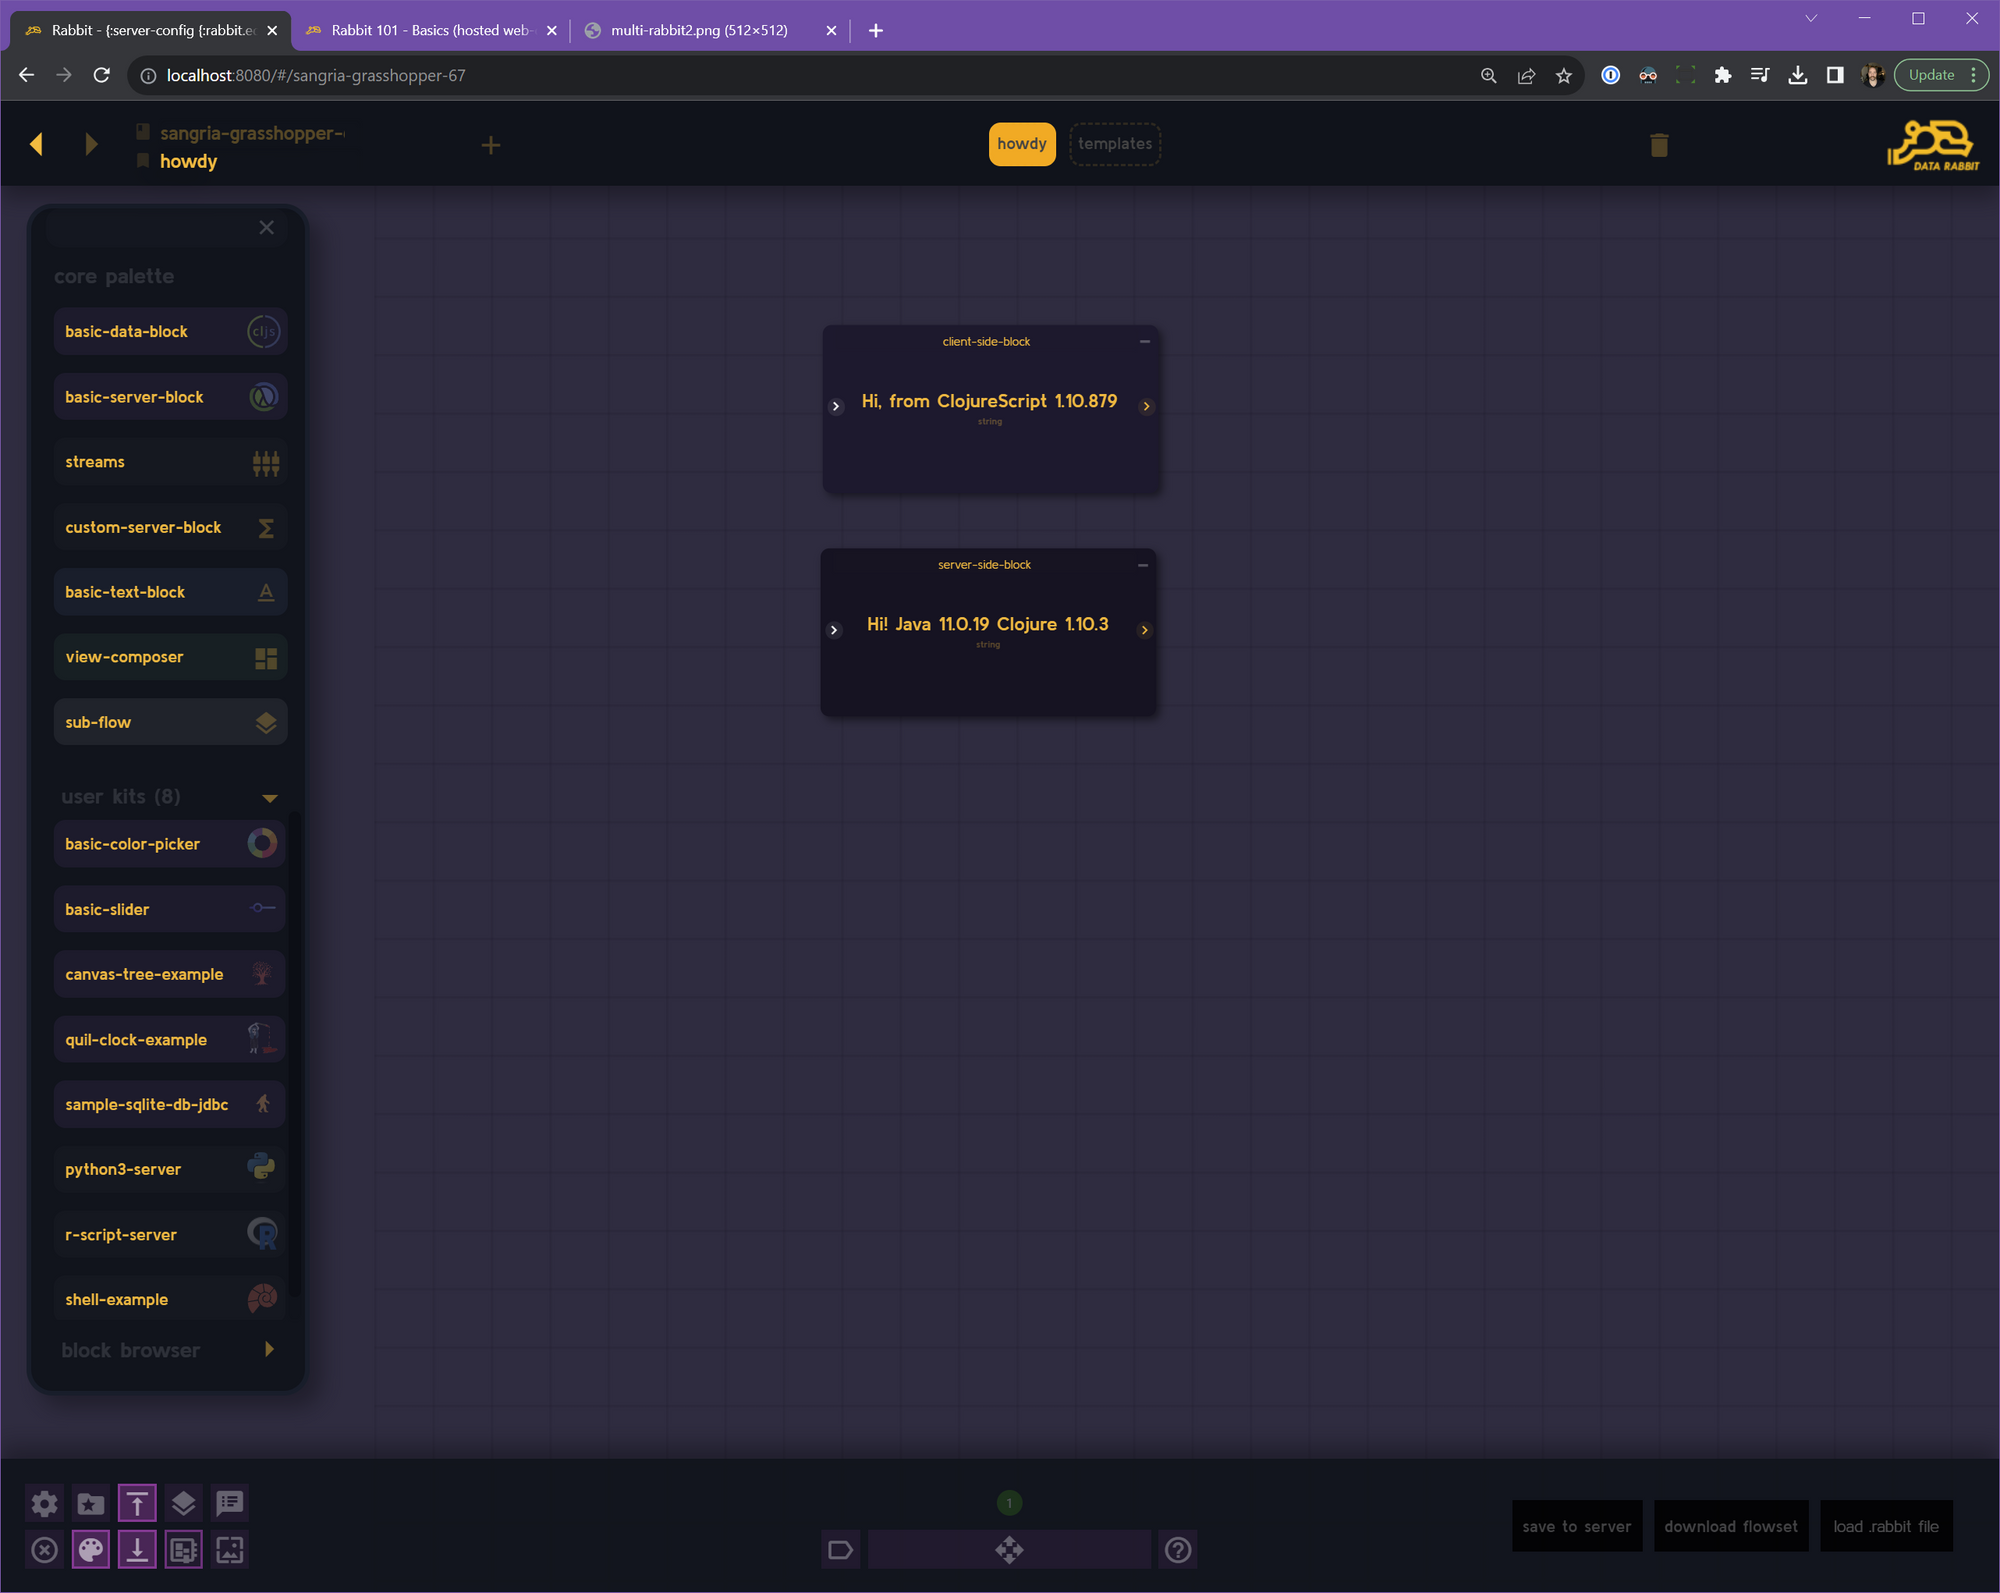
java -jar data-rabbit-ALPHA4-standalone.jar - Go to the web interface, you should see something like this as the default flow gets loaded
http://localhost:8080
- Click on the Plus + sign in the upper left hand corner below where it says flowset browser. This will create a fresh new flow canvas for us to work on.
- Feel free to delete the ClojureScript block by clicking on it's titlebar and hitting shift-delete
- Start up your project REPL / standalone REPL you want to connect to (unless it's just general Clojure REPL things you want to try, in that case you can use Rabbit's built-in 1.10.3 nREPL server).
- Open up the server-side-block on the canvas by clicking on it and hitting shift-W (or use the icons on the lower left corner)
- Add your custom nrepl port and ip address via this comment somewhere in the block:
;:::custom-nrepl {:host "127.0.0.1" :port 44999}
- Now you are free to run whatever code you would do in your normal REPL, but keep in mind that the entire code window gets executed each time, so you might want to comment old lines out or use defonce's etc.
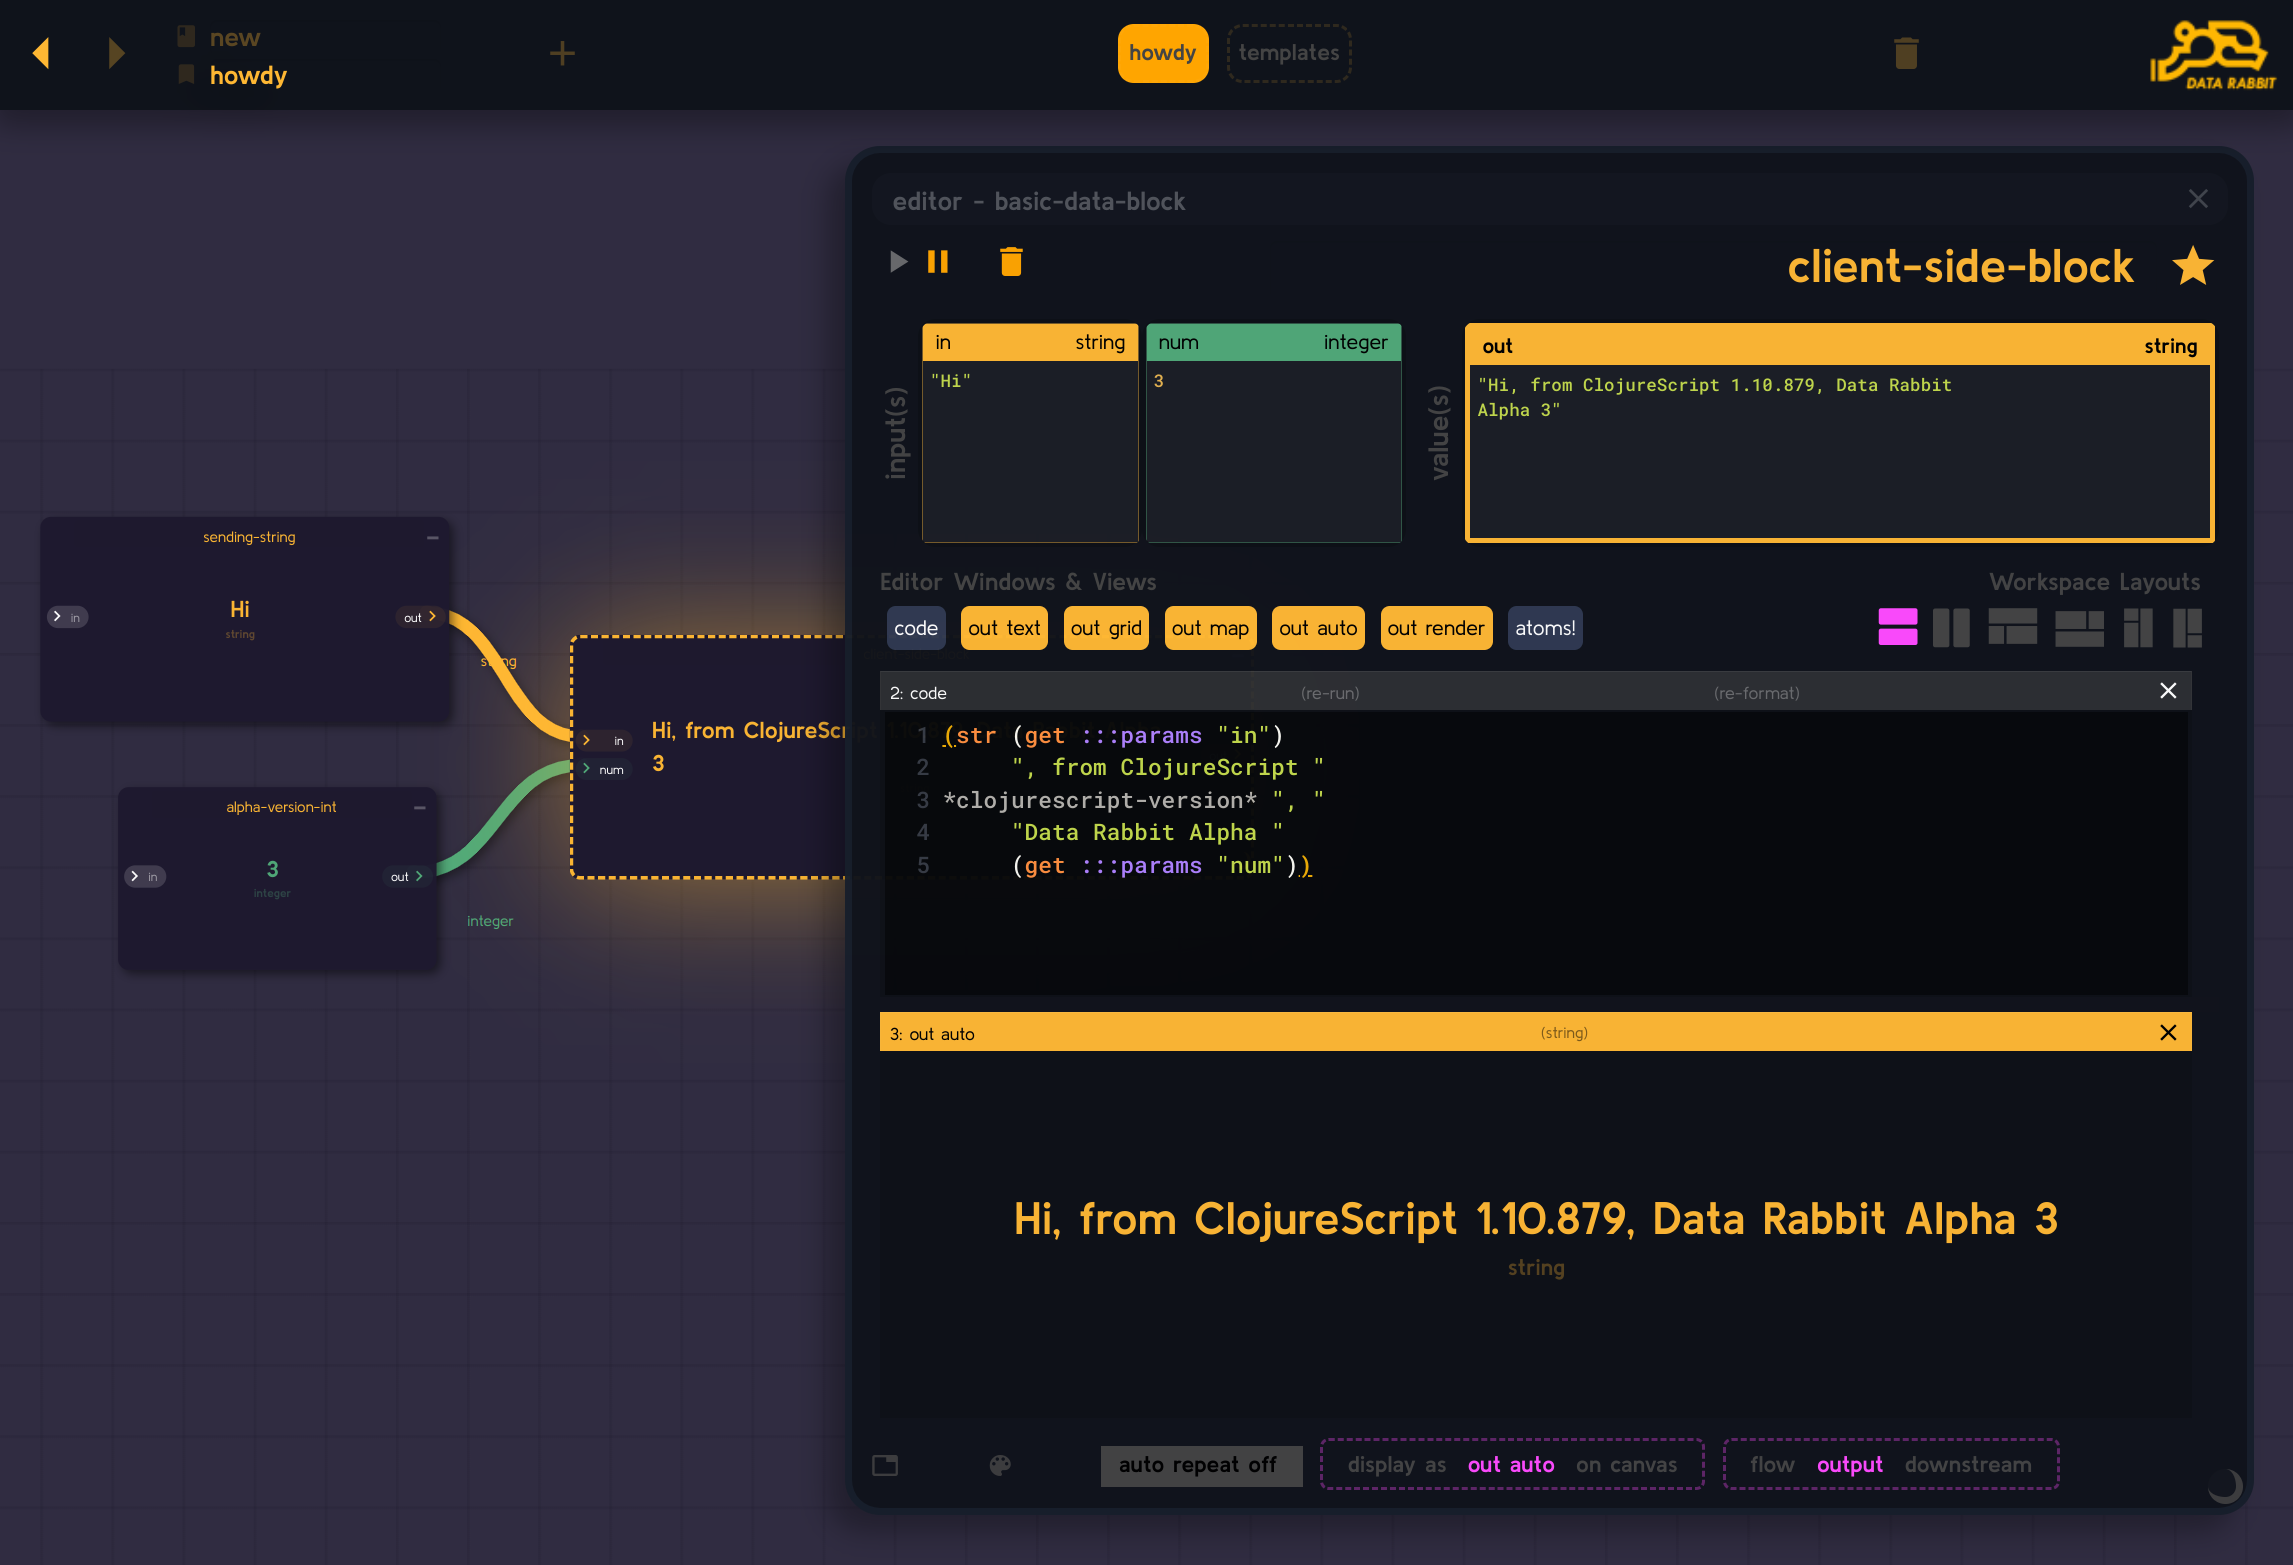
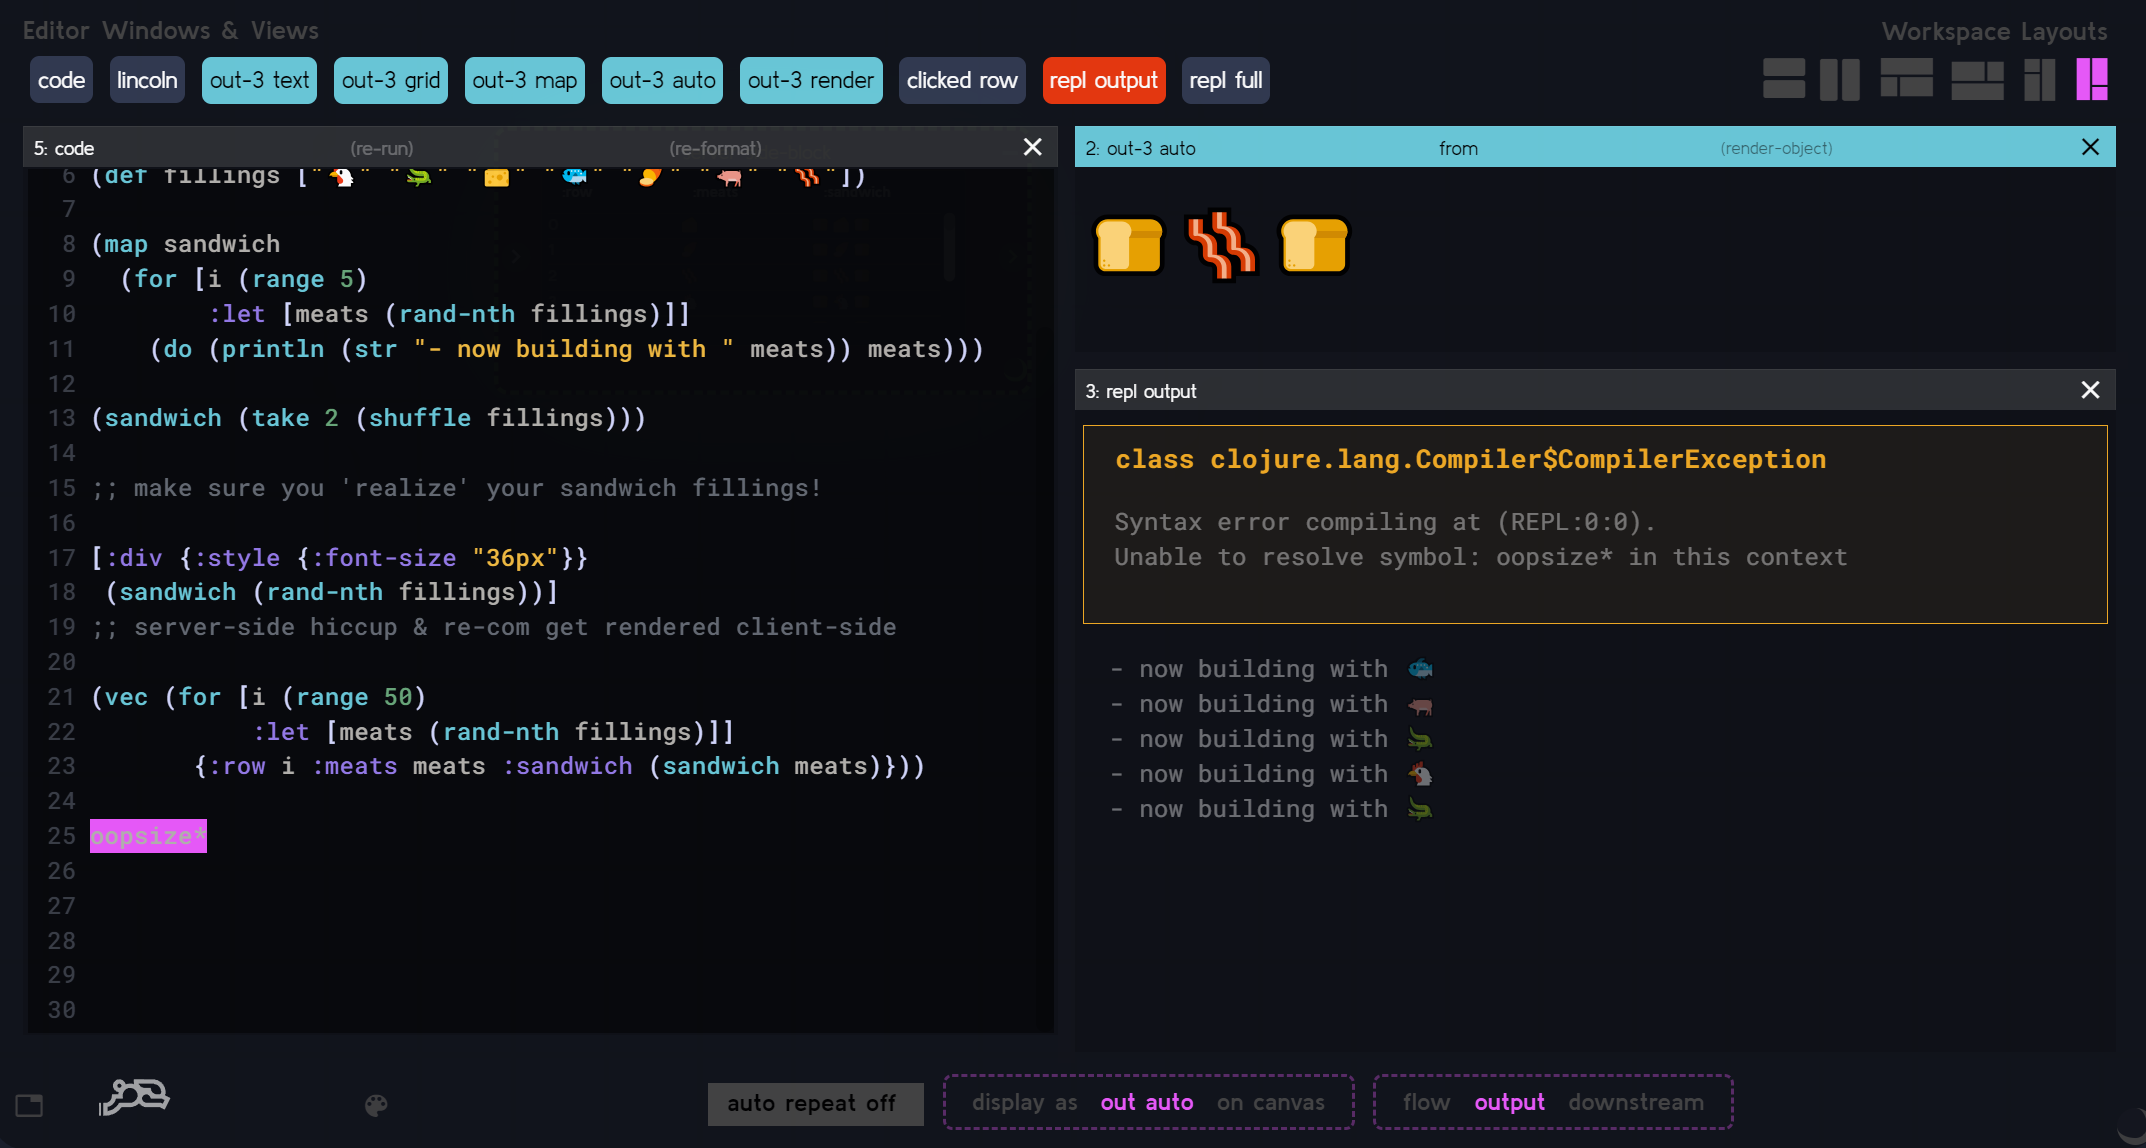
- Unlike a "regular REPL", when multiple forms are executed, we can get multiple outputs and add them to editor panels as we see fit...
- As you can see above - "data" and "console output" are segmented as 2 different things.
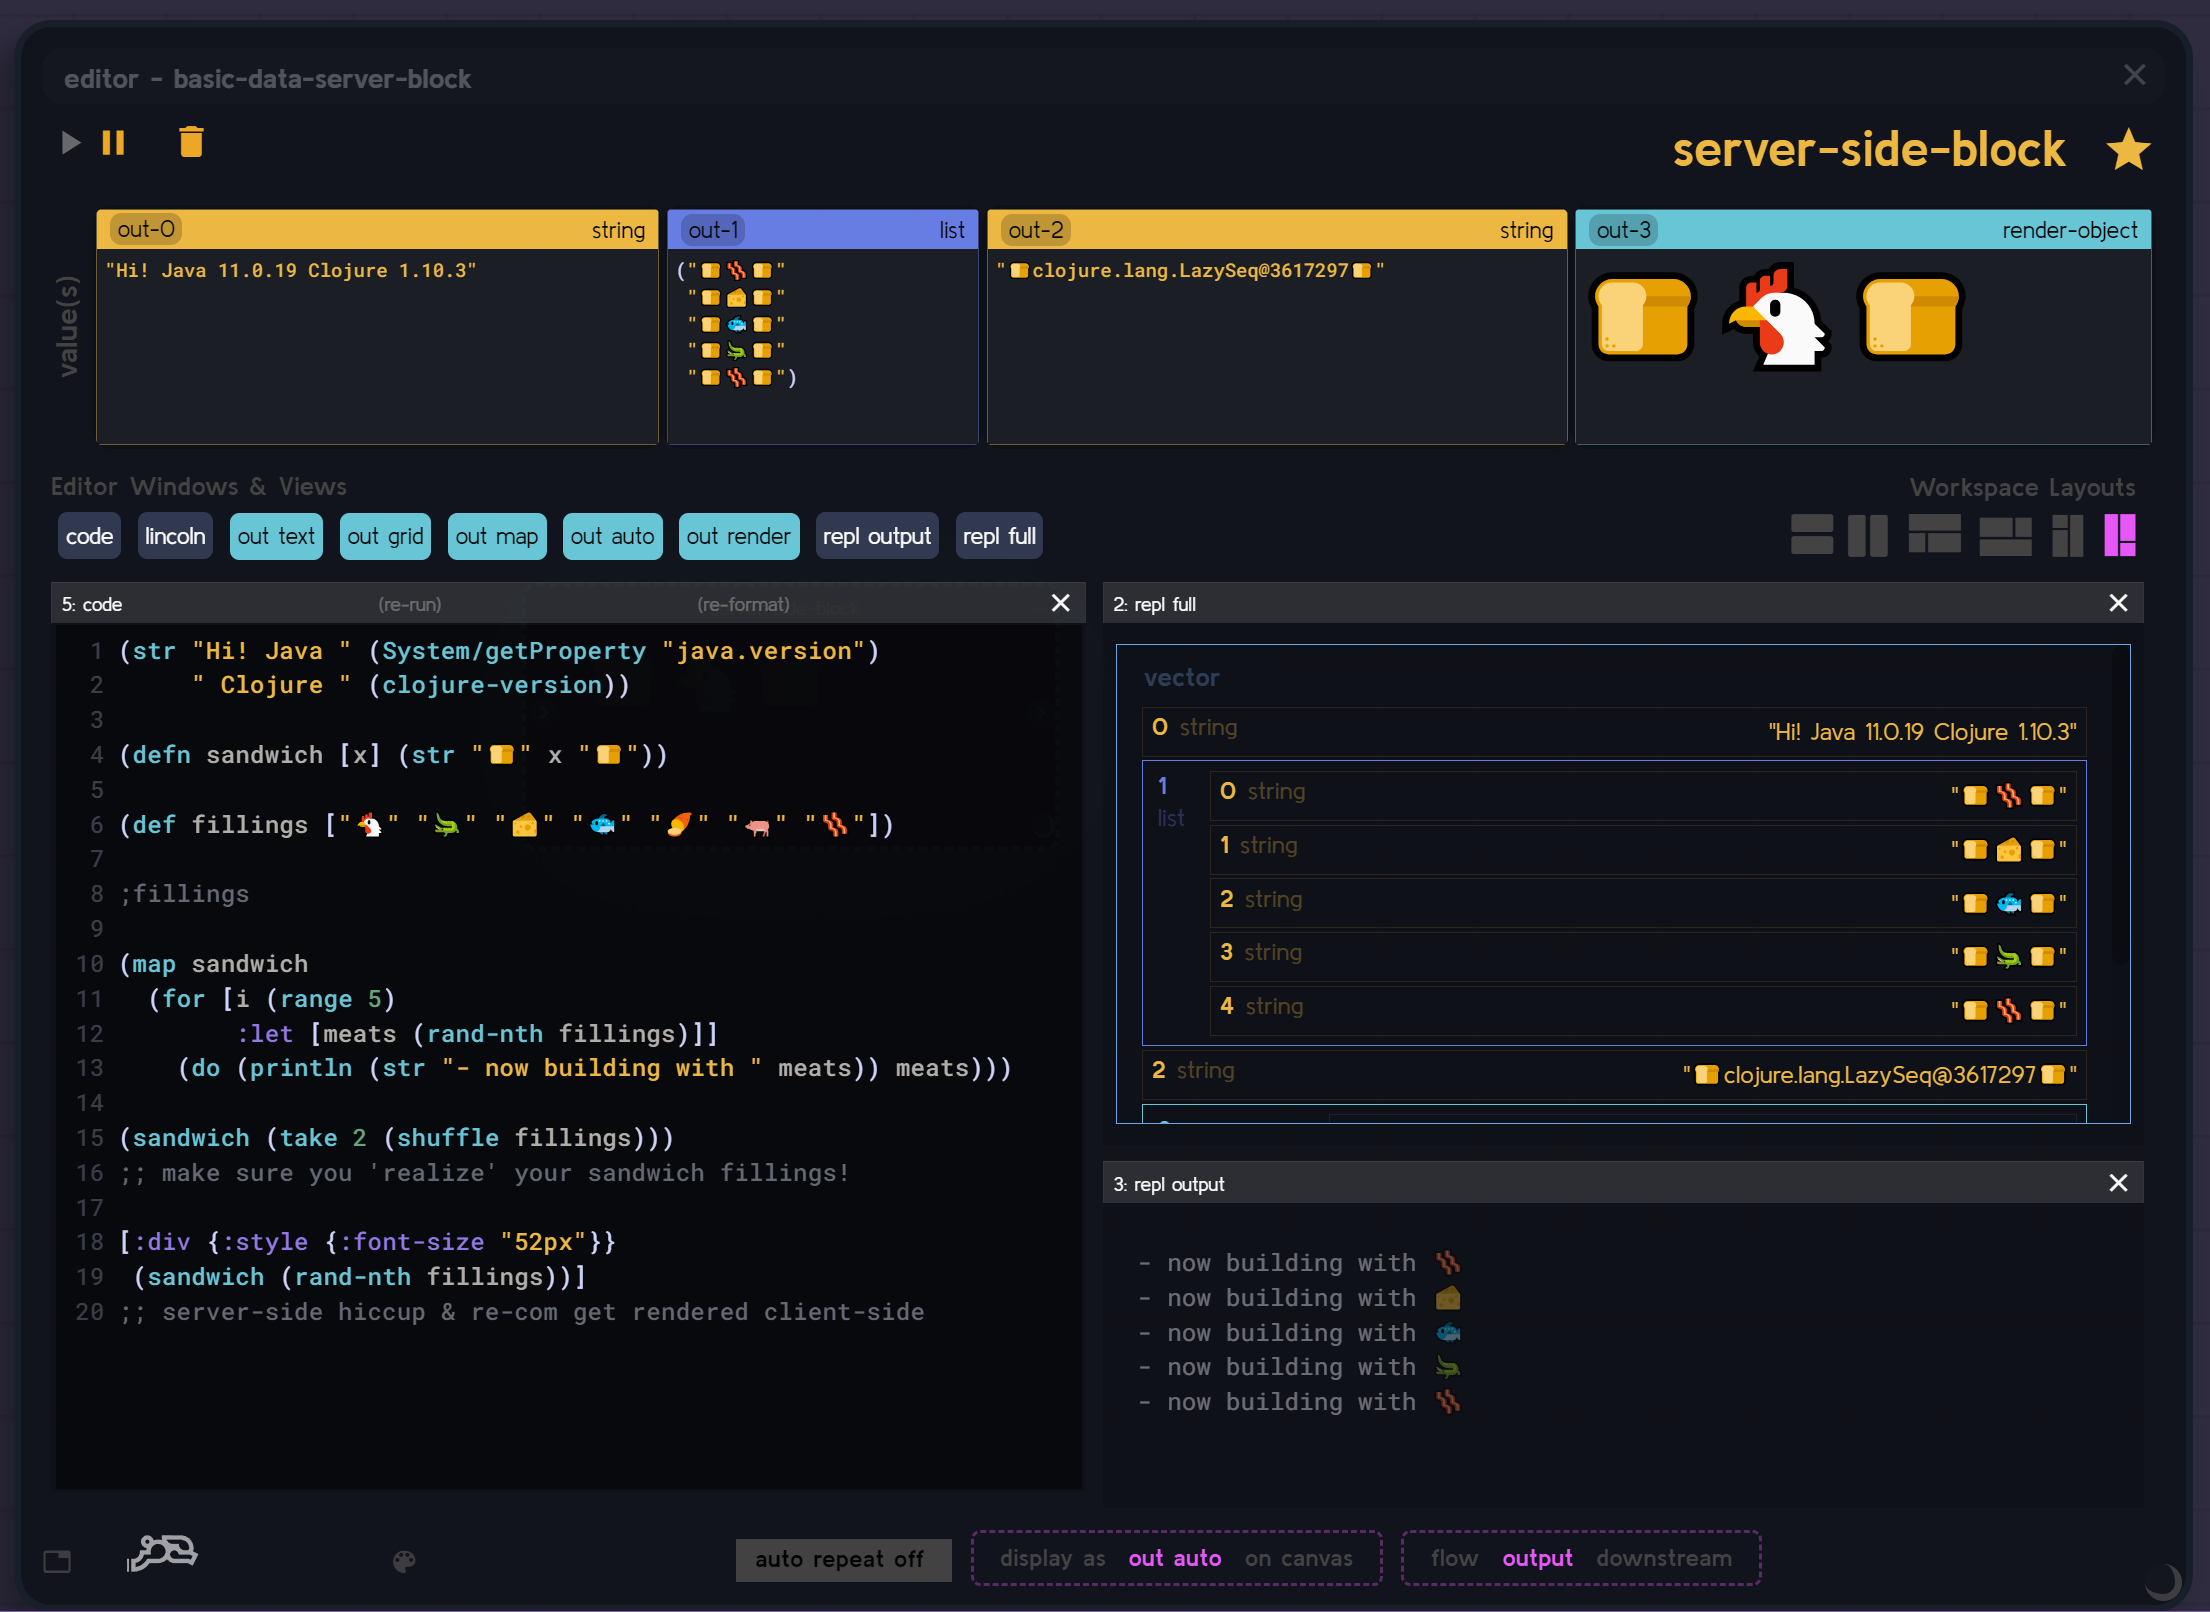
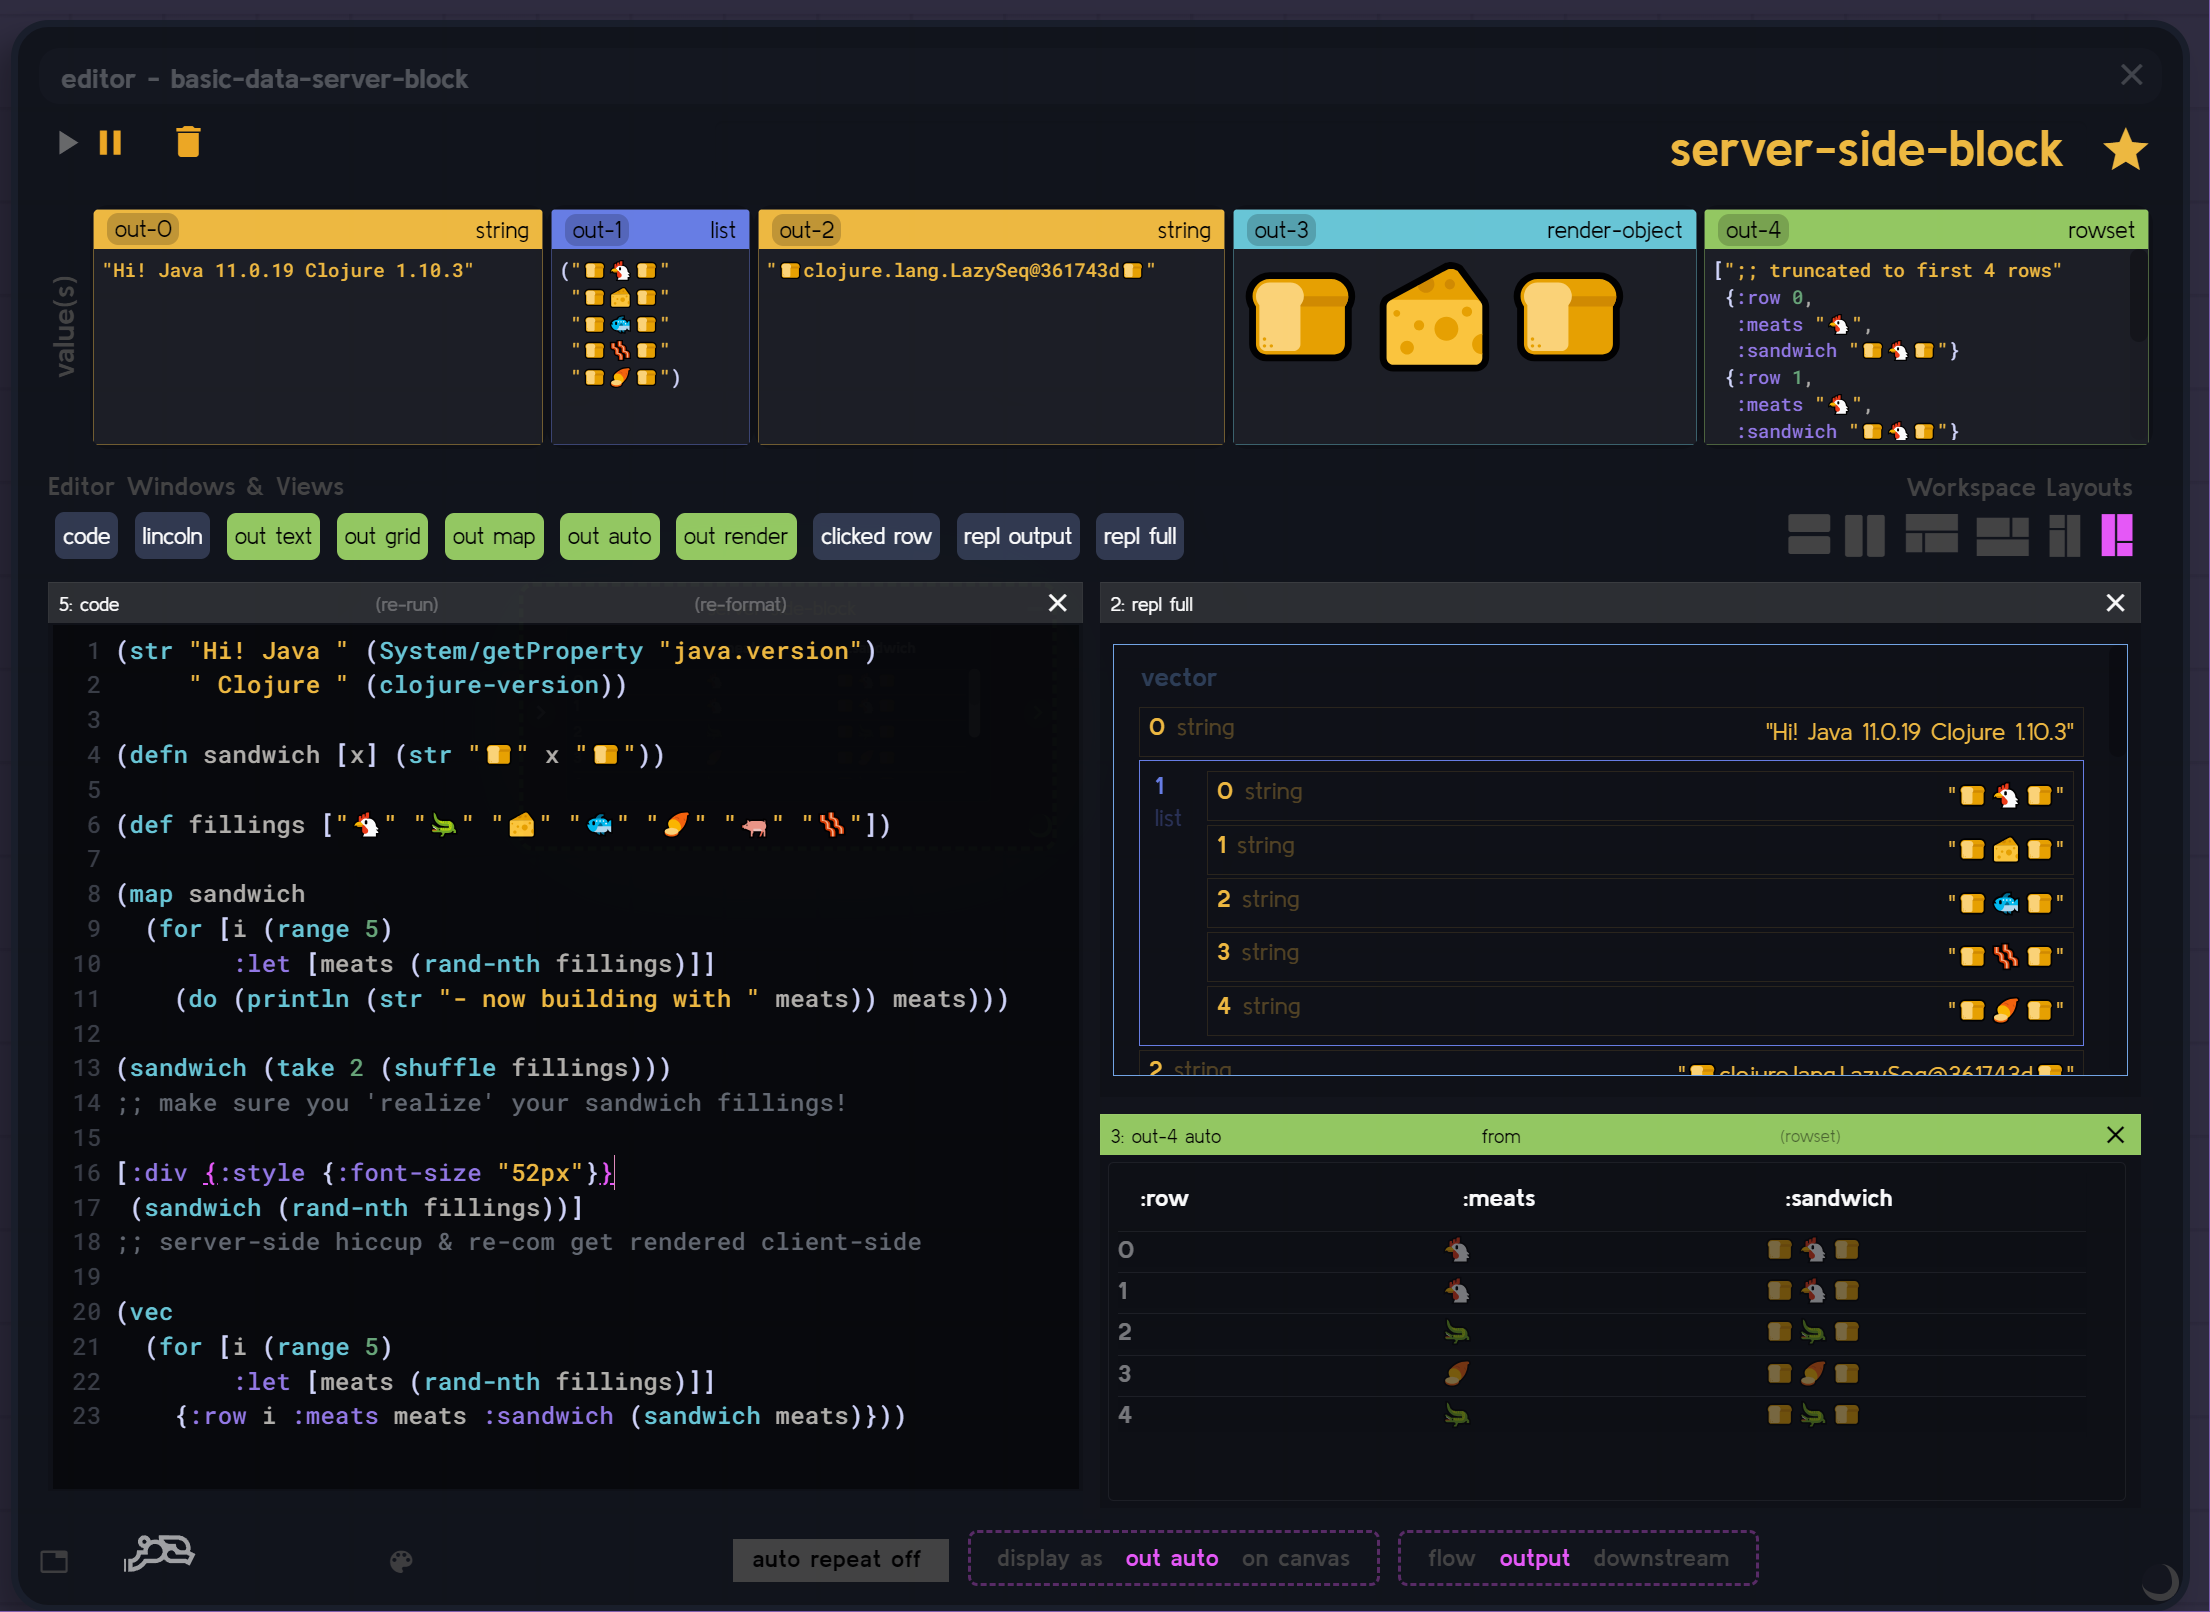
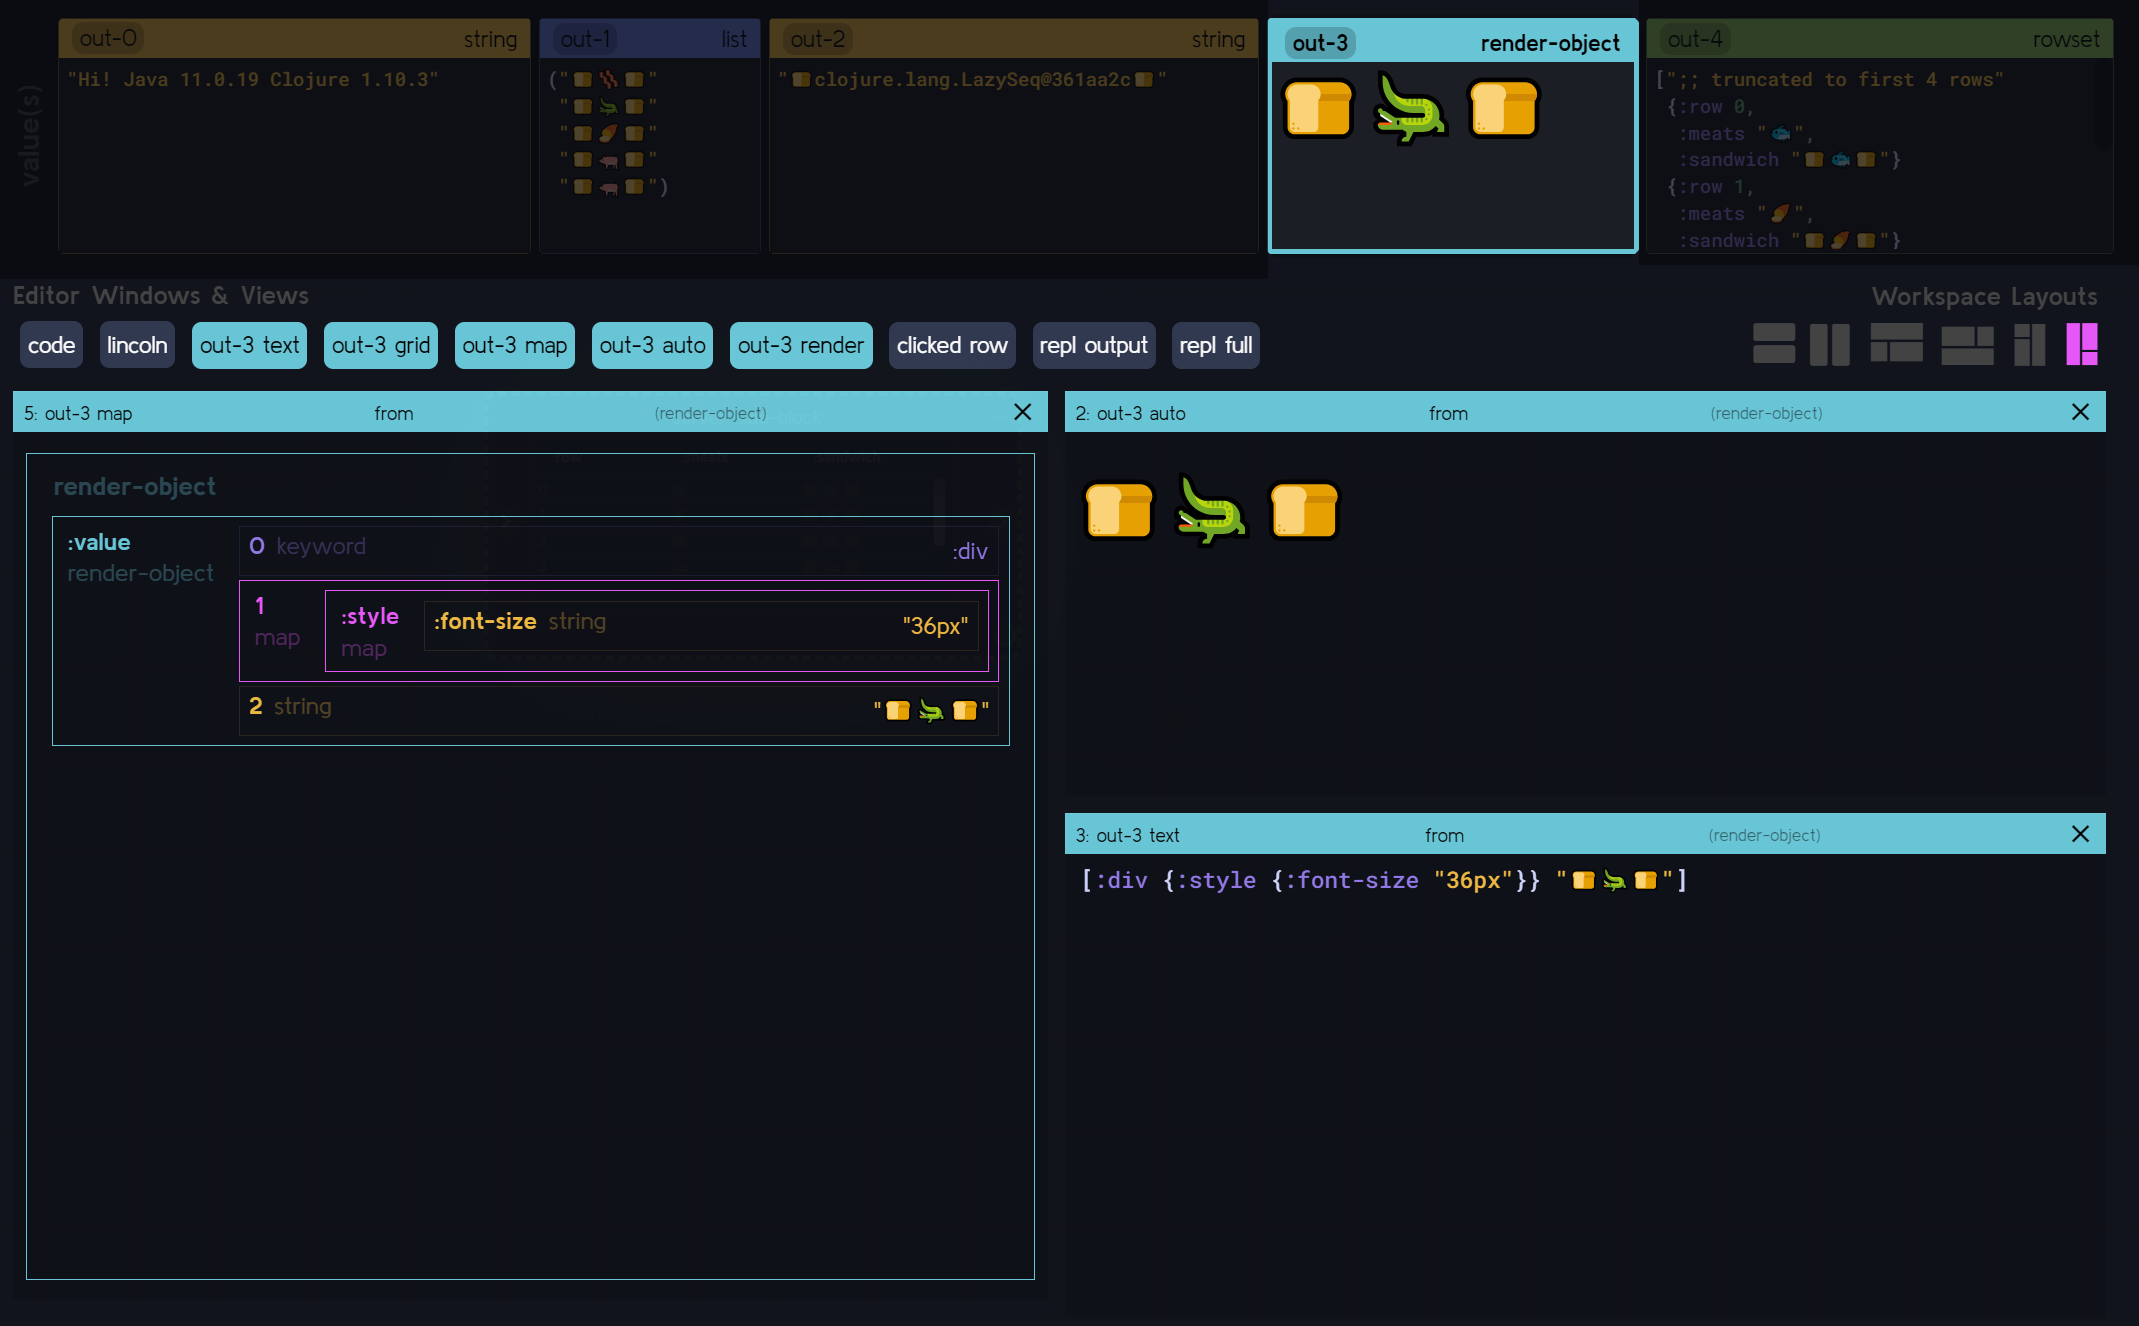
- Move results around the editor panel where you like, and remember, the panel can render hiccup and can display "rowsets" (a vector of uniform maps) as a grid - among other neat tricks.

- Each "output" can be viewed an any way it is compatible with (grid, text, nested map boxes, render, etc). Below we can see the rowset output data viewed in 3 ways.
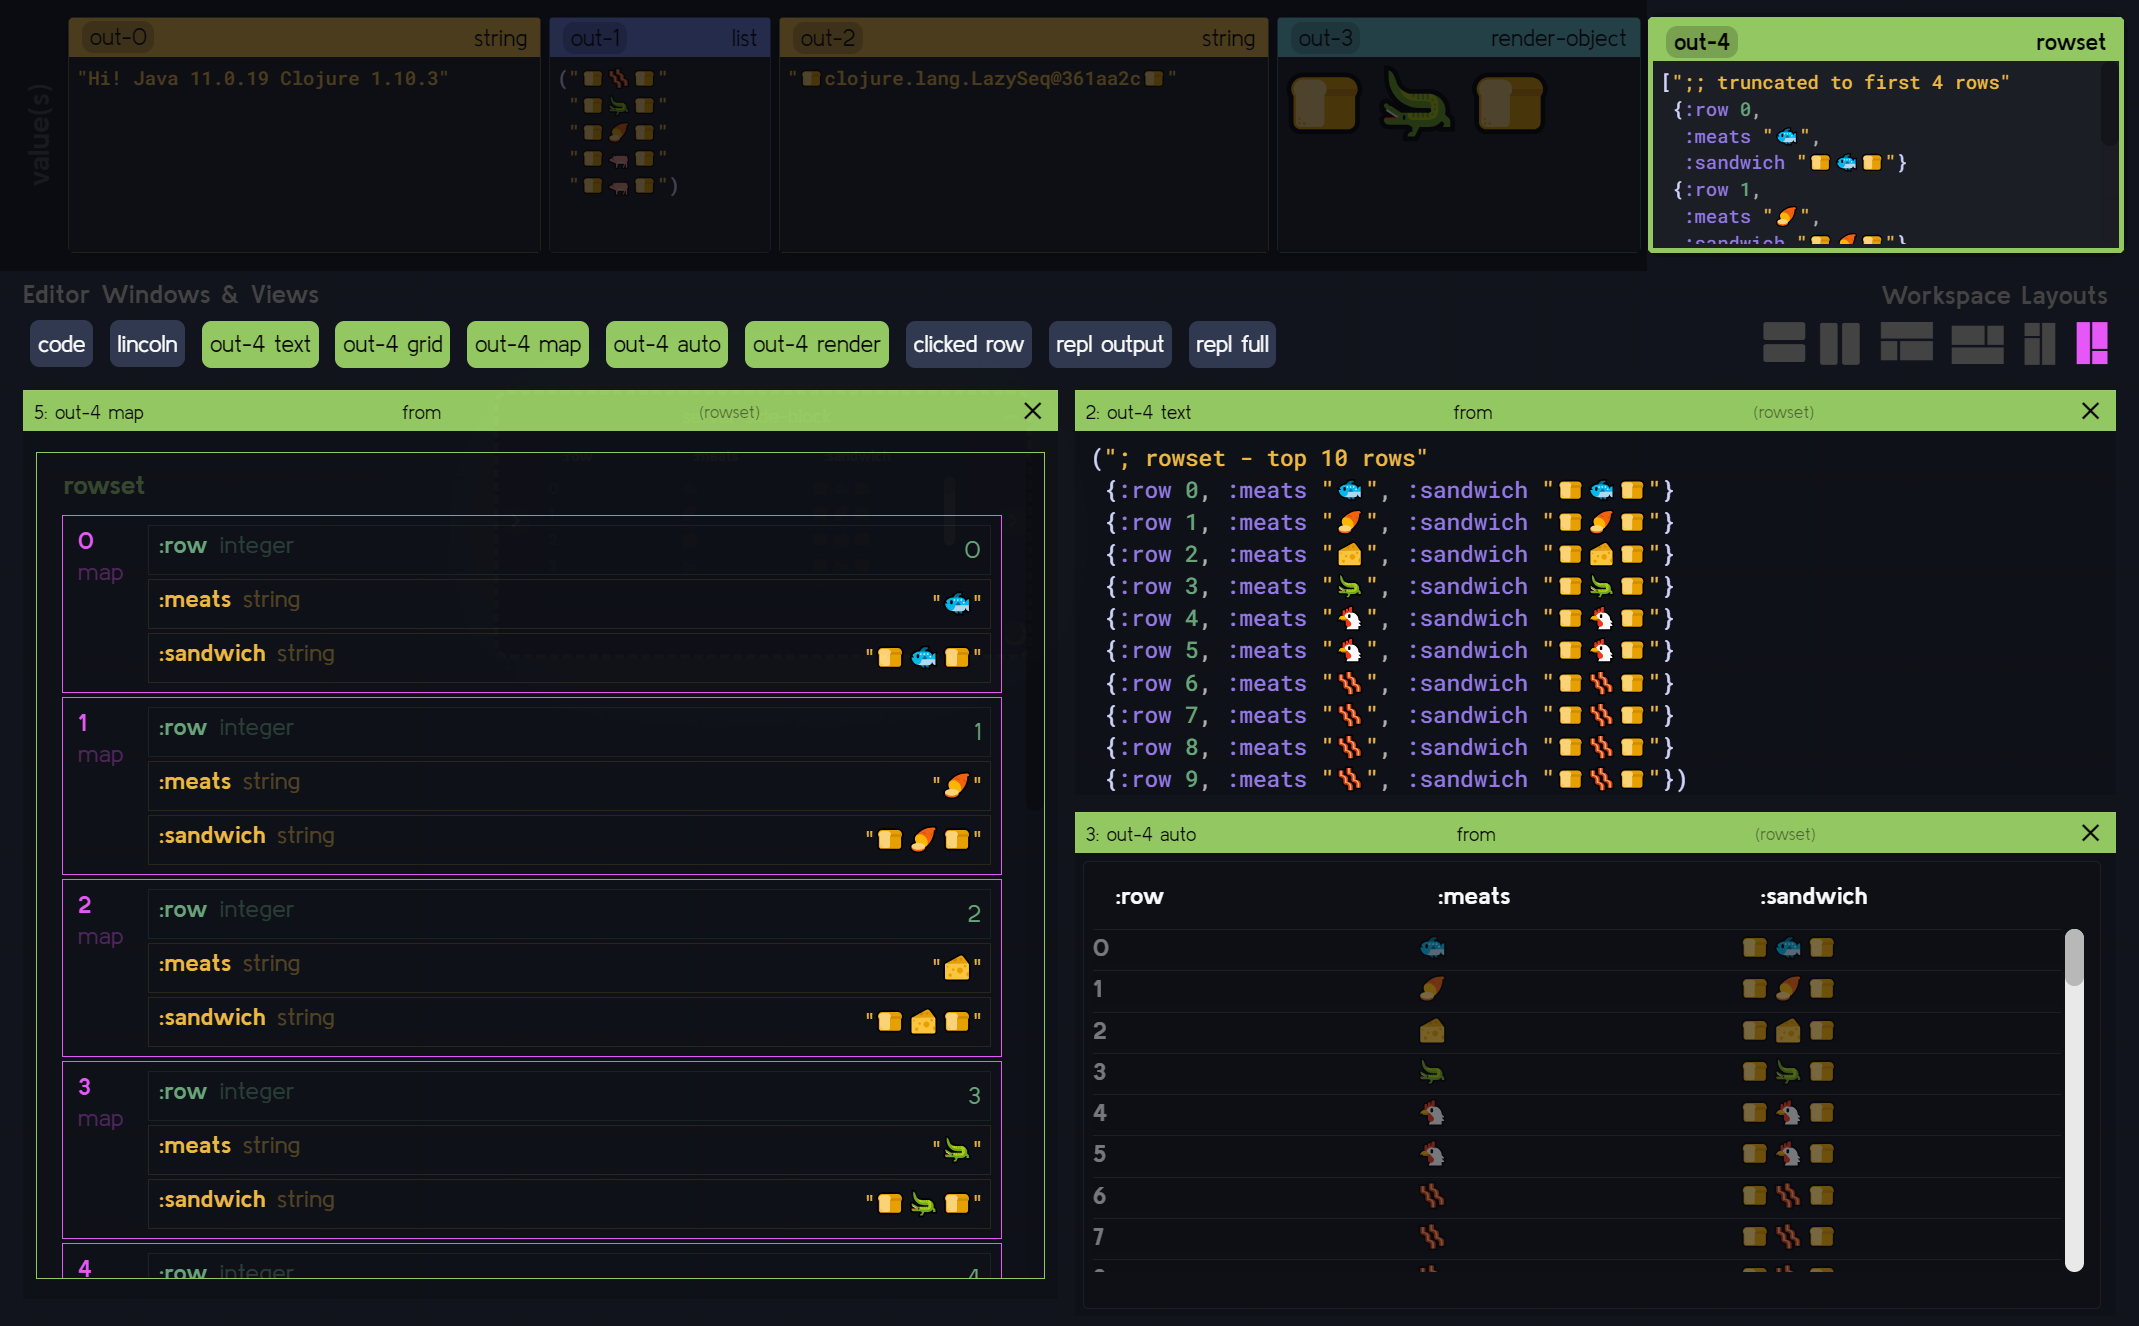
- Same with our hiccup snippet. It's still "just data" after all.
- If one or more of our forms have an error, the "repl output" editor pill will become red, and dragging it into the editor will show the error. The rest of the statements will be unaffected (assuming they don't reference the error, that is).
- Using atoms? Cool. Atoms will be detected by the editor and be available as a panel to view. See below.
- Drag data OUT of the CLJ environment on to the canvas and it will completely mutable by the CLJS features of Rabbit. Then things can get really interesting. For example...
- Bret Victor Voice: "As as we change the source data... the picture changes..."
- Last but not least there is a super-experimental visualization of debux's dbg debugging output called the "lincoln" panel. Each form will get wrapped in dbg and before it is executed and I will attempt to visualize the steps taken.
It needs work (and currently with large loops / data it will 100% crash chrome), but I think you can get an idea of what I'm going for... Here is an example, using our sandwich building loops.